SLIDE 12 INTERNATIONAL INCOME INEQUALITY, 1970-2000: KOLM’S CENTRIST INDEX (Indices: 1970=100) = 365 (dollars) = 730 (dollars)
100 120 140 160 180 200 1970 1975 1980 1985 1990 1995 2000 100 120 140 160 180 200 1970 1975 1980 1985 1990 1995 2000
= 0.2 = 1,176 (dollars) = = 5,881 (dollars)
100 120 140 160 180 200 1970 1975 1980 1985 1990 1995 2000 100 120 140 160 180 200 1970 1975 1980 1985 1990 1995 2000
= 0.2() (dollars) = 0.5() (dollars)
100 120 140 160 180 200 1970 1975 1980 1985 1990 1995 2000 100 120 140 160 180 200 1970 1975 1980 1985 1990 1995 2000
= () (dollars) = 2() (dollars)
100 120 140 160 180 200 1970 1975 1980 1985 1990 1995 2000 100 120 140 160 180 200 1970 1975 1980 1985 1990 1995 2000
INTERNATIONAL INCOME INEQUALITY, 1970-2000: BOSSERT-PFINGSTEN’S INTERMEDIATE INDEX (Indices: 1970=100) = 365 (dollars) = 730 (dollars)
80 90 100 110 120 1970 1975 1980 1985 1990 1995 2000 80 90 100 110 120 1970 1975 1980 1985 1990 1995 2000
= 0.2 = 1,176 (dollars) = = 5,881 (dollars)
80 90 100 110 120 1970 1975 1980 1985 1990 1995 2000 100 120 140 160 180 200 1970 1975 1980 1985 1990 1995 2000
= 0.2() (dollars) = 0.5() (dollars)
100 120 140 160 180 1970 1975 1980 1985 1990 1995 2000 100 120 140 160 180 1970 1975 1980 1985 1990 1995 2000
= () (dollars) = 2() (dollars)
100 120 140 160 180 1970 1975 1980 1985 1990 1995 2000 100 120 140 160 180 1970 1975 1980 1985 1990 1995 2000
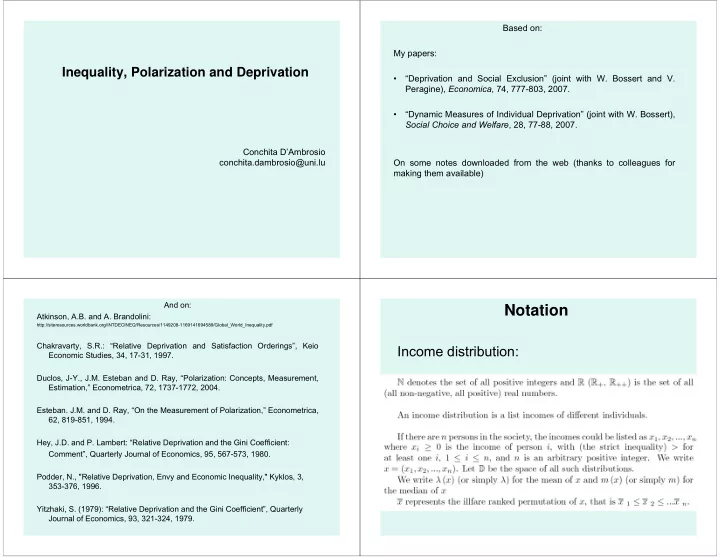
Kolm’s centrist measure basically confirms the pattern shown by Kolm’s absolute measure: international income inequality has been rising for most of the period from 1970 to 2000; it fell slightly
- nly in 1975, in the early 1980s, and in
the early 1990s.
INTERNATIONAL INCOME INEQUALITY, 1970-2000: KOLM’S CENTRIST INDEX (Indices: 1970=100) = 365 (dollars) = 730 (dollars)
100 120 140 160 180 200 1970 1975 1980 1985 1990 1995 2000 100 120 140 160 180 200 1970 1975 1980 1985 1990 1995 2000
= 0.2 = 1,176 (dollars) = = 5,881 (dollars)
100 120 140 160 180 200 1970 1975 1980 1985 1990 1995 2000 100 120 140 160 180 200 1970 1975 1980 1985 1990 1995 2000
= 0.2() (dollars) = 0.5() (dollars)
100 120 140 160 180 200 1970 1975 1980 1985 1990 1995 2000 100 120 140 160 180 200 1970 1975 1980 1985 1990 1995 2000
= () (dollars) = 2() (dollars)
100 120 140 160 180 200 1970 1975 1980 1985 1990 1995 2000 100 120 140 160 180 200 1970 1975 1980 1985 1990 1995 2000
INTERNATIONAL INCOME INEQUALITY, 1970-2000: BOSSERT-PFINGSTEN’S INTERMEDIATE INDEX (Indices: 1970=100) = 365 (dollars) = 730 (dollars)
80 90 100 110 120 1970 1975 1980 1985 1990 1995 2000 80 90 100 110 120 1970 1975 1980 1985 1990 1995 2000
= 0.2 = 1,176 (dollars) = = 5,881 (dollars)
80 90 100 110 120 1970 1975 1980 1985 1990 1995 2000 100 120 140 160 180 200 1970 1975 1980 1985 1990 1995 2000
= 0.2() (dollars) = 0.5() (dollars)
100 120 140 160 180 1970 1975 1980 1985 1990 1995 2000 100 120 140 160 180 1970 1975 1980 1985 1990 1995 2000
= () (dollars) = 2() (dollars)
100 120 140 160 180 1970 1975 1980 1985 1990 1995 2000 100 120 140 160 180 1970 1975 1980 1985 1990 1995 2000
These long-run tendencies are common to all specifications of the index. Movements
- ver shorter periods, however, may differ
across alternative combinations
the parameters .
INTERNATIONAL INCOME INEQUALITY, 1970-2000: KOLM’S CENTRIST INDEX (Indices: 1970=100) = 365 (dollars) = 730 (dollars)
100 120 140 160 180 200 1970 1975 1980 1985 1990 1995 2000 100 120 140 160 180 200 1970 1975 1980 1985 1990 1995 2000
= 0.2 = 1,176 (dollars) = = 5,881 (dollars)
100 120 140 160 180 200 1970 1975 1980 1985 1990 1995 2000 100 120 140 160 180 200 1970 1975 1980 1985 1990 1995 2000
= 0.2() (dollars) = 0.5() (dollars)
100 120 140 160 180 200 1970 1975 1980 1985 1990 1995 2000 100 120 140 160 180 200 1970 1975 1980 1985 1990 1995 2000
= () (dollars) = 2() (dollars)
100 120 140 160 180 200 1970 1975 1980 1985 1990 1995 2000 100 120 140 160 180 200 1970 1975 1980 1985 1990 1995 2000
INTERNATIONAL INCOME INEQUALITY, 1970-2000: BOSSERT-PFINGSTEN’S INTERMEDIATE INDEX (Indices: 1970=100) = 365 (dollars) = 730 (dollars)
80 90 100 110 120 1970 1975 1980 1985 1990 1995 2000 80 90 100 110 120 1970 1975 1980 1985 1990 1995 2000
= 0.2 = 1,176 (dollars) = = 5,881 (dollars)
80 90 100 110 120 1970 1975 1980 1985 1990 1995 2000 100 120 140 160 180 200 1970 1975 1980 1985 1990 1995 2000
= 0.2() (dollars) = 0.5() (dollars)
100 120 140 160 180 1970 1975 1980 1985 1990 1995 2000 100 120 140 160 180 1970 1975 1980 1985 1990 1995 2000
= () (dollars) = 2() (dollars)
100 120 140 160 180 1970 1975 1980 1985 1990 1995 2000 100 120 140 160 180 1970 1975 1980 1985 1990 1995 2000
The four bottom panels of Kolm look like the corresponding panels of B-P, due to proportionality of indices, and confirm the long-run tendency towards higher inequality.
Global income inequality
A-B try to bring in within-country inequality. The data for the world distribution of income are those constructed by Bourguignon and Morrisson (2002). Their method is to use evidence on the national distribution (or the distribution for a grouping of countries) about the income shares of decile groups, and the top 5 per cent. The groups are treated as homogeneous, which means that the degree of overall inequality is under-stated, but their data provide a valuable starting point. The distributional data are then combined with estimates of national GDP per head, expressed in constant purchasing power parity dollars (at 1990 prices), which are in turn derived from the historical time series constructed by Maddison (1995).