Notes: GIS Applications in Fire Ecology & Management Lesson 6 - - PDF document

notes
SMART_READER_LITE
LIVE PREVIEW

Notes: GIS Applications in Fire Ecology & Management Lesson 6 - - PDF document

NR406 Notes: GIS Applications in Fire Ecology & Management Lesson 6 Rem ote Sensing Estim ate of Fire Severity NR406: GIS Applications in Fire Ecology and Management Notes: Burned Area Reflectance Classification ( BARC) Burned Area


slide-1
SLIDE 1

NR406

GIS Applications in Fire Ecology & Management

Lesson 6 Rem ote Sensing Estim ate of Fire Severity

Notes:

NR406: GIS Applications in Fire Ecology and Management

Remote sensing methods for assessing burn severity

http://burnseverity.cr.usgs.gov/help.asp

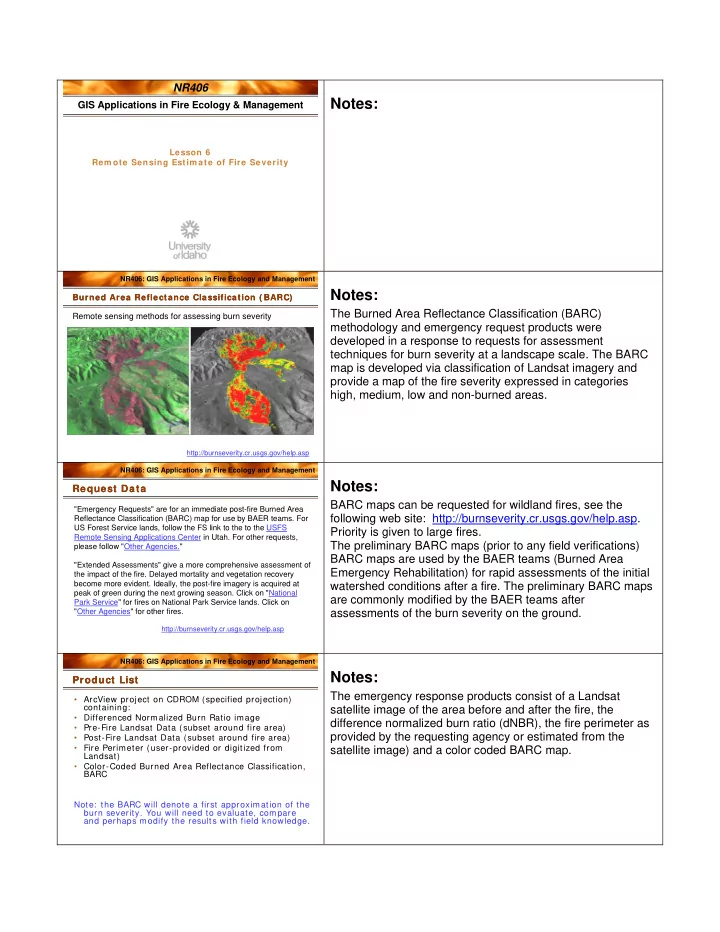
Burned Area Reflectance Classification ( BARC) Burned Area Reflectance Classification ( BARC)

Notes:

The Burned Area Reflectance Classification (BARC) methodology and emergency request products were developed in a response to requests for assessment techniques for burn severity at a landscape scale. The BARC map is developed via classification of Landsat imagery and provide a map of the fire severity expressed in categories high, medium, low and non-burned areas.

NR406: GIS Applications in Fire Ecology and Management

Request Data Request Data

"Emergency Requests" are for an immediate post-fire Burned Area Reflectance Classification (BARC) map for use by BAER teams. For US Forest Service lands, follow the FS link to the to the USFS Remote Sensing Applications Center in Utah. For other requests, please follow "Other Agencies." "Extended Assessments" give a more comprehensive assessment of the impact of the fire. Delayed mortality and vegetation recovery become more evident. Ideally, the post-fire imagery is acquired at peak of green during the next growing season. Click on "National Park Service" for fires on National Park Service lands. Click on "Other Agencies" for other fires.

http://burnseverity.cr.usgs.gov/help.asp

Notes:

BARC maps can be requested for wildland fires, see the following web site: http://burnseverity.cr.usgs.gov/help.asp. Priority is given to large fires. The preliminary BARC maps (prior to any field verifications) BARC maps are used by the BAER teams (Burned Area Emergency Rehabilitation) for rapid assessments of the initial watershed conditions after a fire. The preliminary BARC maps are commonly modified by the BAER teams after assessments of the burn severity on the ground.

NR406: GIS Applications in Fire Ecology and Management

Product List Product List

  • ArcView project on CDROM (specified projection)

containing:

  • Differenced Normalized Burn Ratio image
  • Pre-Fire Landsat Data (subset around fire area)
  • Post-Fire Landsat Data (subset around fire area)
  • Fire Perimeter (user-provided or digitized from

Landsat)

  • Color-Coded Burned Area Reflectance Classification,

BARC Note: the BARC will denote a first approximation of the burn severity. You will need to evaluate, compare and perhaps modify the results with field knowledge.

Notes:

The emergency response products consist of a Landsat satellite image of the area before and after the fire, the difference normalized burn ratio (dNBR), the fire perimeter as provided by the requesting agency or estimated from the satellite image) and a color coded BARC map.

slide-2
SLIDE 2

NR406: GIS Applications in Fire Ecology and Management

Landsat 7 Landsat 7 Landsat 7 Path 42 row 28 July 27, 2000

Notes:

Here is a Landsat 7 image of the area before the Maloney Creek fire on Craig Mountain in August year 2000. This image is displayed in the False Color Infrared color combination where the green vegetation is displayed in the red color-gun and therefore looks red.

NR406: GIS Applications in Fire Ecology and Management

Landsat 7 Landsat 7

Landsat 7 Path 42 row 28 August 28, 2000

Notes:

This Landsat image was taken after the fire.

NR406: GIS Applications in Fire Ecology and Management

Electrom agnetic Spectrum Electrom agnetic Spectrum

Notes:

Remember the electromagnetic spectrum? This graphic shows the wavelengths for radiation along the electromagnetic

  • spectrum. Ultraviolet radiation has a shorter wavelength than

visible radiation which has a shorter wavelength than near infrared and so on.

NR406: GIS Applications in Fire Ecology and Management

Landsat Satellite Sensor Landsat Satellite Sensor

Notes:

The Landsat satellite sensor records images from the blue to the mid infrared. In this graph you can see the corresponding wavelength for each Landsat band. Band 1 – blue Band 2 – green Band 3 – red Band 4 – near infraded Band 5 – mid infraded Band 6 – Thermal (not displayed in the graph) Band 7 – mid infrared The graph also shows the reflectance for different substances (sandstone, green vegetation, limestone, shale) along the electromagnetic spectrum. Notice the low reflectance for

slide-3
SLIDE 3

green vegetation in band 1, 2, 3 and the high reflectance in the near infrared. The reflectance for green vegetation in band 7 is also relatively low. The reflectance for soil is higher than for green vegetation in band 7.

NR406: GIS Applications in Fire Ecology and Management

  • conversion of DN to reflectance values
  • geometric correction

(assign a coordinate system to the image)

  • atmospheric correction if necessary

I m age pre-processing I m age pre-processing

Notes:

A few steps of image pre-processing is necessary before the Landsat images can be classified into NBR and BARC maps. These steps include conversion of the digital numbers in the raw image to reflectance values, geometric correction (georeferenceing), and in some cases atmospheric correction.

NR406: GIS Applications in Fire Ecology and Management

A Landsat TM Radiometric Measure of Burn Severity

NBR = (R4 – R7) / (R4 + R7)

http://nrmsc.usgs.gov/research/ndbr.htm Norm alized Burn Ratio ( NBR) Norm alized Burn Ratio ( NBR)

Notes:

The NBR index is computed by subtracting the reflectance value in Landsat band 7 and band 4 and then dividing by the sum of band 7 and 4. Band 4 is selected because of the high reflectance of green vegetation in the near infraded (Landsat band 4) and band 7 is selected because bare soil reflects highly in this part of the electromagnetic spectrum.

NR406: GIS Applications in Fire Ecology and Management

July 27, 2000 August 28, 2000

Craig Mountain area before and after the Maloney Creek Fire Craig Mountain area before and after the Maloney Creek Fire

Notes:

The Landsat sensor provides an image every 16 days for any area of the world. The emergency response products changes through time as the burned area begins to recover and green vegetation returns to the area. There are two standard products 1) the IMMEDIATE assessment where the images immediate before and after the fire are used to compute NBR, 2) the EXTENDED assessment where the after-the-fire image is taken one year after fire. The EXTENDED assessment includes information about ecosystem recovery potential and delayed mortality.

slide-4
SLIDE 4

NR406: GIS Applications in Fire Ecology and Management

http://burnseverity.cr.usgs.gov/pdfs/LAv4_BR_CheatSheet.pdf

Delta NBR cheat sheet Delta NBR cheat sheet

Notes:

The difference in NBR before and after the fire is computed (dNBR) and then classified into severity levels. The raw dNBR classification normally ranges from –500 to 1300 and are classified into severity level according to the table in this slide. The dNBR index was developed after the fires in Glacier National Park in 1994 in forested ecosystems. Reading 6: Key CH and Benson NC. 2006. Landscape

  • assessment. Sampling and Analysis Methods, USDS Forest

Service General Technical Report RMRS-GTR-164 (available

  • n the course web site).

NR406: GIS Applications in Fire Ecology and Management

Burn Severity Evaluation in the Field

CBI – Com posite Burn I ndex CBI – Com posite Burn I ndex

Notes:

The NBR and dNBR indices derived from remote sensing sources have been related to ground data via the Composite Burn Index (CBI). CBI incorporates factors from all strata such as soil color and condition, vegetation or fuel consumed, re- sprouting from burned plants, scorch of trees, re- establishment of plants, etc. See reading for further information on the CBI field assessment and relation to NBR. Reading 6: Key CH and Benson NC. 2006. Landscape assessment. Sampling and Analysis Methods, USDS Forest Service General Technical Report RMRS-GTR-164 (available on the course web site). There is currently no common standard for how to evaluate ‘burn severity’ in an ecological sense. There is still a need for further evaluation of the relationship between NBR and ground measurements in various ecosystems. Further reading if this is your interest area: Lentile et al. 2006 Remote sensing techniques to assess active fire and post-fire effects, International Journal of Wildland Fire, 15, 3, 319-345).

NR406: GIS Applications in Fire Ecology and Management

Key and Benson 2006

Stratification for ground based sam pling Stratification for ground based sam pling

  • Stratify by dNBR class if a BARC map is available
  • No need to sample across the entire area – that is what

remote sensing is for

  • Choose accessible areas
  • 50-100 plots per burn is usually adequate, distributed

equally across severity levels

  • GIS can help with stratification and site selection
  • Hawth’s tools is an ArcGIS extension that can create

random or stratified sampling locations

Notes:

Key and Benson recommends stratification according to the BARC map (high, medium, low etc.) when collecting CBI data

  • n the ground. They further state that there is no need to

place samples across the entire burn, rather choose accessible areas near roads. We use remote sensing to be able to extrapolate from not so remote areas to remote areas.! Usually 50-100 CBI plots is sufficient (10-20 per severity class) unless the fires are very large. GIS can help with the planning of CBI plot locations by showing roads overlayed with the BARC map. Hawth’s tools is a relatively new third party extension for ArcGIS that alllows users to create stratified samples within selected areas (http://www.spatialecology.com/htools/tooldesc.php).