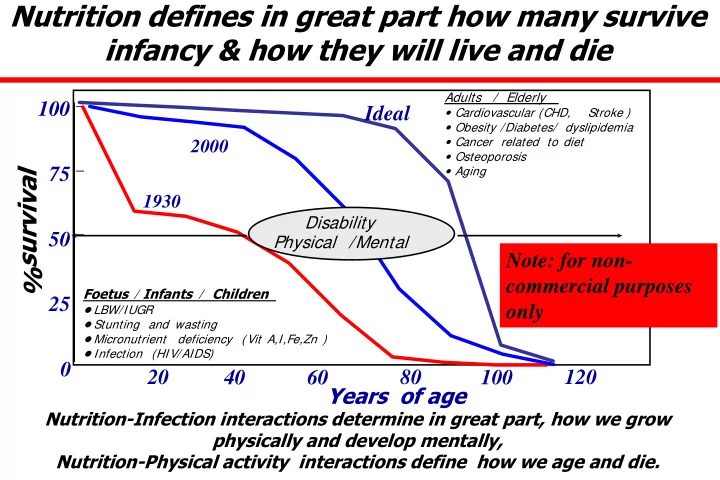
SLIDE 1 Nutrition defines in great part how many survive infancy & how they will live and die
Years of age 25 50 75 100 20 40 60 80 100 120
1930 2000
Foetus / Infants / Children
- LBW/IUGR
- Stunting and wasting
- Micronutrient deficiency (
Vit A,I,Fe,Zn )
Adults / Elderly
Stroke )
- Obesity /Diabetes/ dyslipidemia
- Cancer related to diet
- Osteoporosis
- Aging
Ideal
% survival
Nutrition-Infection interactions determine in great part, how we grow physically and develop mentally, Nutrition-Physical activity interactions define how we age and die.
Disability Physical /Mental
Note: for non- commercial purposes
SLIDE 2
We grow and develop according to age
Determinants of loss
SLIDE 3 Deaths attributable to 16 leading risk factors: all countries
3000 6000 7000 8000 1000 2000
Deaths (000)
4000 5000 Low mortality – Developing countries High mortality – Developing countries Developed countries
Adapted from World Health Report 2008 Blood pressure
Tobacco Use
Cholesterol Underweight
Unsafe sex
Fruit & vegetable High body mass Index Physical inactivity Alcohol
Unsafe water, hygiene
Indoor smoke/fuels Iron deficiency
Urban air pollution
Zinc deficiency Vitamin A deficiency
Unsafe health/injections
SLIDE 4
Underweight for age < 5 yrs (WHO-UNICEF-BM 2012)
SLIDE 5
Stunting < 5 yrs Globally (WHO-UNICEF-BM 2012)
SLIDE 6
Wasting low weight for height in < 5 yrs in (WHO-UNICEF-BM 2012)
SLIDE 7
Prevalence of obesity < 5 yrs globally
(WHO-UNICEF-WB 2012)
SLIDE 8 14 million premature deaths due to NCDs
Source: WHO, 2008
http://www.who.int/healthinfo/global_burden_disease/2004_report_update/en/index. html
SLIDE 9 Source: WHO, 2011 https://apps.who.int/infobase/CountryProfiles.aspx
Premature deaths due to NCDs in developing countries (men)
SLIDE 10 Premature deaths due to NCDs in developing countries (women)
Source: WHO, 2011 https://apps.who.int/infobase/CountryProfiles.aspx
SLIDE 11 Pre Pregnancy BMI Maternal Glucose Insulin Placental Fetal blood flow Fetal growth restriction Fetal Macrosomia feeding fast Weight gain Early Adiposity rebound Pubertal Sexual maturation Central Obesity Metabolic syn High BMI Obesity
Hormonal responses
Hormonal responses
SLIDE 12
Preconceptional Gestational Infant Folic acid Overweight Malnutrition BMI BMI Diabetes
Nutrition: Critical Timing
Micronutrients I, Vit A, Fe, EFA, Zn
SLIDE 13 Assessing Early Life I Interventions I
- Early life interventions to prevent the consequences of
malnutrition are now well established as a priority for global health and human development.
- The prevention of early death is a key component of
the millennium development goals to be met by 2015.
- We now seek to promote optimal growth and mental
development as key for human-social development; the early years lay the biological foundation for productive social and educational investments, building human capital with lifelong returns.
SLIDE 14 CONSEQUENCES OF UNDERNUTRITION UNDERNUTRITION
Productivity Social Exclusion Unemployment Mortality School performance Morbidity Acute & Chronic Mental Development
Increase Costs
(private– públic)
Malnutrition not only affects those who are malnourished but also affects the whole of society
Martínez R y Fernández A. Modelo de análisis del impacto social y económico de la desnutrición infantil en A.L. CEPAL 08
Malnutrition is both an ethical & a socio-economic issue
SLIDE 15 Incidental
Age at which effects are documented
Age at which loss occurss or identified
0 - 4 6 - 18 15 - 64 X Health Education Productivity
Prospective
18 2 64 11 4
Retrospective
TWO APPROACHES IN EVALUATING COSTS OF HUNGER
source: Economic Commission for Latin America ECLA 2008
SLIDE 16 It estimates the health costs of pre-school boys and girls who suffer from under nutrition during the year of analysis, It considers the educational costs stemming from the undernutrition children now in school suffered during the first five years of life Includes economic costs due to lost productivity by working-age individuals who were exposed to under- nutrition before the age of five.
The cost of hunger: Social and economic impact of child undernutrition…
Incidental retrospective dimension (Estimate of the
cost of undernutrition in a country’s population for a given year)
SLIDE 17
Serves to project the present and future losses incurred as a result of medical treatment, repetition of grades in school, and lower productivity caused by under-nutrition among children under the age of five in each country, in a specific year. Based on that, potential savings derived from actions taken to achieve nutritional objectives can be estimated (for example, to attain MDG1, reducing undernutrition by half by 2015).
The cost of hunger: Social and economic impact of child undernutrition…
Prospective: potential savings approach
SLIDE 18 Estimated Losses for 13 countries studied was US $ 17 billion or 3.4% of Aggregate GNP
Estimated total cost of childhood malnutrition (US dollars and percent GNP 2004-2005)
Fuente: CEPAL, sobre la base de información oficial y registro de costos de educación de cada país; Ingresos y escolaridad, de encuestas de hogares de cada país
Central America & Dominican Rep (2004) Andean Countries & Paraguay (2005)
Total US $ (Million)
6,659 10,552
Percent GNP
6.4 2.6
500 1000 1500 2000 2500 3000 3500 4000 4500
VEN CRI PAR PAN PER COL ECU RDO NIC BOL ELS HON GUA
0% 2% 4% 6% 8% 10% 12%
Total Cost Percent country GNP Millon US dollars
SLIDE 19 Impact of malnutrition in Latin America(2004-05)
source: Economic Commission for Latin America ECLA 2008
Higher mortality and lost opportunity for education determine 93% of the cost of hunger.
Health is only 6.5% and school repetition less than 1%.
Health (Morbidity) 7% Education (Repetition) 1% Productivity (Education ) 41% Productivity (Mortality) 52%
lost productivity based on poor linear growth
SLIDE 20 Stunting: nting: the hidde den n impact act
The missing normal rapid growers Probable disrupted growth. Children might have Normal or Above average growth.
Very High Average Low Very Low
Height ght for r Age
Classi sified ed as Stunt nted ed
13% 13% 39% 39% 54% 54%
14% at risk +2.0 S.D. +1.5 S.D.
The normal al range e of childh dhood d growth th Sub-Sa Sahar haran an Africa ca
Those classified as Stunted fall below the lowest limit (-2.0 S.D.) of normal linear growth.
South th Ameri rica ca
SLIDE 21 DEATHS ATTRIBUTABLE TO 16 LEADING RISK FACTORS:
3000 6000 7000 8000 1000 2000
Deaths (000)
4000 5000 Low mortality – Developing countries High mortality – Developing countries Developed countries
Adapted from World Health Report 2008 Blood pressure
Tobacco Use
Cholesterol Underweight
Unsafe sex
Fruit & vegetable High body mass Index Physical inactivity Alcohol
Unsafe water, hygiene
Indoor smoke/fuels Iron deficiency
Urban air pollution
Zinc deficiency Vitamin A deficiency
Unsafe health/injections
SLIDE 22 WHO Chronic Disease report 2005
SLIDE 23
% of total DALYs lost OBESITY Under nutrition
SLIDE 24 Body size in the French population
(Fogel 1997) Secular trends in developing countries 1970-2000
Stature m BMI
Ideal trends
Surface plots relating stature, weight, BMI and RISK of DEATH
SLIDE 25
SLIDE 26 Impact of Early Life Interventions II
- We recognize that the interventions required to
prevent stunting and improve brain development are complementary but differ from those needed to reduce underweight & wasting.
- The issue is not about choosing between
addressing under-nutrition in the poor versus treating obesity in the affluent; but how to maximize human development potential preventing death/disability in the early years with a life course perspective.
SLIDE 27 Assessing Impact of Early Life Interventions III
- We need to assess the biological, social and economic
impact of the various options beyond counting lives saved.
- We must include the quality of life of those that survive
and the resulting economic benefits to individuals and society.
- The economic cost of preventable “adult non
communicable chronic diseases” (NCDs) must be integrated in our impact analysis of early nutrition
SLIDE 28 Assessing Impact of Early Life Interventions IV
- The largest fraction of these losses relate to
poorer brain development and lower educational achievement followed by early death/disability of adults, all impact economic productivity and national development.
- We should be talking to the Ministry of Finance
and National Development and not only to the ministers of Health and Education
SLIDE 29
Health Policy. 2007 Mar 13; 83:295-303
SLIDE 30
Background
In January 2000, the Chilean Ministry of Health mandated required fortification with folic acid (FA) at the level of 2.2 mg per kg of wheat flour to reduce the risk of neural tube defects (NTD) This policy would result in a mean additional intake of approximately 400 μg/d based on consumption of fortified bread. Program effectiveness was established documenting increased plasma and RBC folate content and lower incidence of NTD.
SLIDE 31 Pre – fortification (n:120,636 livebirths) Post – fortificaction (n: 117,101 livebirths) Risk Reduction Health Outcome Rate Rate RR (95%CI) Anencephaly 0.61 0.37 0.39 (0.10 – 0.59) Encephalocele 0.24 0.19 0.22 ( (-0.44) – 0.57) Spina Bífida 0.86 0.45 0.48 (0.26 – 0.63) NTD live births 1.33 0.89 0.33 (0.14 – 0.49)
.
Assessment of Effectiveness in NTD Reduction
Base Based on
data ta fr from
valuation tion of
NTD be befor
(1999 99-20 2000 00) ) an and d afte after (20 (2001 01-20 2002 02) ) implemen implementa tation tion of
heat flour flour for
tifica cation tion.
SLIDE 32
MEDICAL AND REHABILITATION COST ESPINA BIFIDA
Cost/Case Espina Bifida (2002 $ US)
Surgical correction 2,450 Rehabilitation (1 year) 4,555 Extended to 20 ys 100,209 Extended to 20 ys (3% Discounted) 74,763
SLIDE 33
PROGRAM COST
Cost Mill Industry ($US)
Flour fortification 211,865 Quality Control 63,600 Total Cost 275,465
SLIDE 34 EFFECTIVENESS
- Women reaching target intake.
FA intake estimated from consumption of fortified bread suggest that 45% of women of reproductive age reached > 400 ug/day. Population of women of reproductive age (15-45 yrs) in Chile 3 591 688 (Vital Statistics INE, 2002).
- Number of NTD cases prevented.
Incidence of NTD 2 yrs before and 2 yrs after intervention (evaluation in 9 Hospitals in Santiago; 60,000 births per year). Vital statistic of total live birth and fetal death. (INE, 2002).
SLIDE 35 RESULTS
- From a total population of 3,591,688
women of reproductive age, 1,724, 010 reached the target intake of FA.
16 $ US cents
SLIDE 36 COST PER SELECTED HEALTH OUTCOMES
Cases Prevented Cost/Case Prevented* Health Outcome n º Total Anencephaly 60 $4,591 Encephalocele 13 $22,036 Spina Bífida 103 $2,687 NTD live births 110 $2,515
* Obtained
Obtained f from dividing the
tota
l cost of st of th the pr e prog
am by by the the numb number of er of cas cases es pr preven ented ted.
SLIDE 37
COST SAVINGS PER SPINA BIFIDA CASE PREVENTED
Surgical and rehabilitation cost extended to 20 years of life per child with spina bifida was: $ US 100,209 $ US 74,763 ( 3% discount rate) Extrapolating this cost to the 110 infants with Spina Bifida that were averted by the program, the average year- saving for the health system was: $US 10,973,308 $US 8,187,596
SLIDE 38 The result of the cost-effectiveness analysis supports the implementation of this intervention despite the low incidence of NTD. Cost-saving per spina bifida case averted corresponds to the yearly expenditure by the public health system for approximately 400 people in Chile. Further analyses will include determination of cost of
- ther measures of effectiveness such as QUALYs and
DALYs
SLIDE 39 Health Economic Model for Assessing the Impact of High Birth Weight on Public Health
Ir Irene ene Lenoir Lenoir-Wijnk ijnkoop
, Mar Mark Nuijten k Nuijten2, , Eline Eline M.
van der der Beek Beek3 & Ricar & Ricardo Uauy do Uauy4
MONDAY NOV 18TH 2013
1DEPARTEMENT OF PHARMACEUTICAL SCIENCES, UNIVERSITY OF UTRECHT, THE
NETHERLANDS;
2ACCESSUS MEDICA, THE NETHERLANDS; 3NUTRICIA RESEARCH, SINGAPORE; 4INSTITUTE OF NUTRITION INTA UNIVERSITY OF CHILE, CHILE
THIS STUDY WAS SUPPORTED BY A GRANT FROM THE DANONE INSTITUTE INTERNATIONAL, FRANCE
SLIDE 40
Prevalence of macrosomia, macrosomia delivered by pre-labor caesarean delivery and LGA births from 1994 – 2005 USA data
SLIDE 41 MACROSOMIC BIRTH & SHORT TERM COMPLICATIONS FOR MOTHER & CHILD Macrosomia increases neonatal risks
Birth Weight Grade Risks 4000 – 4499 g I Mother+ newborn (induction of labour, caesarean delivery, and birth injuries) 4500 – 4999 g II Neonatal morbidity (5-min Apgar <3, meconium aspiration, and greater risk of lung immaturity) > 5000 g III Birth trauma and death
Boulet et al. Am J Obstet Gynecol 2003 Stotland et al. Int J Gynecol Obstet 2004
Birth weight is associated with maternal complications
SLIDE 42 $7.990 $11.794 $13.047 $7.990 $11.794 $13.684 $0 $3.799 $5.243 $0 $4.646 $5.699
$7.990 $15.593 $18.290 $7.990 $16.440 $19.383
$0 $5.000 $10.000 $15.000 $20.000 $25.000
Normal GDM Overweight Normal GDM Overweight Pregnancy and Delivery Short term costs mother & child (<6yrs)
Total Child Mother
SLIDE 43 A budget impact analysis (BIA) of GDM for the USA was calculated based on an assumption of
GDM incidence at 5.5%3. This leads to an annual number of cases
- f GDM of 236,139 in the USA.
BIA based on 5.5% GDM = $2,544,632,345 USD
Irene Lenoir-Wijnkoop1, Mark Nuijten2, Eline M. van der Beek3 & Ricardo Uauy4
SLIDE 44
SLIDE 45
SLIDE 46
Why should we use Measures of Disease Burden DALYs Assessing performance. country-specific (or regional) measure of the burden of disease provides an outcome indicator that can be used over time to judge progress and performance across countries or regions Forum for informed debate of values and priorities. Disease burden in practice, requires participation of a broad range of specialists. Debating appropriate values, for disability weights or for years of life lost Identifying national disease control priorities. Many countries now identify a relatively short list of interventions, implementation becomes a clear priority for national political and administrative attention. Allocating training time for clinical and public health practitioners. Allocating research and development resources. Effort proportional to the size of the problem being addressed, comparison across diseases in terms cost per daly prevented.
SLIDE 47
SLIDE 48
Interventions identified in Scaling Up Nutrition (SUN)
Vit A supplementation for children 6-59 m of age Therapeutic zinc supplements as diarrhea Rx in children 6-59 m In-home fortification of complementary food for children 6-23 m Deworming medication for pre-school aged children Iron-folic acid supplementation for pregnant women Iron fortification of staple foods Salt iodization for the general population Every effort was made to obtain estimates on current coverage rates for each of the interventions. The “uncovered” target population was approximated and the additional cost of providing the interventions was calculated. The goal coverage rate was assumed to be 100% of the target population for each intervention
SLIDE 49 Direct Interventions to Prevent/Treat Undernutrition Promoting good nutritional practices ($2.9 billion):
❑ breastfeeding
❑ complementary feeding for infants after the age of six months ❑ improved hygiene practices including handwashing ❑ Increasing intake vitamins/minerals ($1.5 billion) young children/mothers: ❑ periodic Vitamin A supplements ❑ therapeutic zinc supplements for diarrhoea management ❑ multiple micronutrient powders ❑ de-worming drugs for children (to reduce losses of nutrients) ❑ iron-folic acid supplements for women to prevent and treat anaemia ❑ iodized oil capsules where iodized salt is unavailable Provision of micronutrients through food fortification for all: ❑ salt iodization ❑ iron fortification of staple foods Therapeutic feeding for malnourished children ($6.2 billion):
❑ prevention or treatment for moderate undernutrition ❑ treatment of severe undernutrition (“severe acute malnutrition”) with ready-to-use therapeutic foods (RUTF).
SLIDE 50
How Much Health Will a Million Dollars Buy?
SLIDE 51
How Much Health Will a Million Dollars Buy?
SLIDE 52
How Much Health Will a Million Dollars Buy?
SLIDE 53