
SLIDE 1
1 Cornell Program on Applied Demographics On the web: http://pad.human.cornell.edu Email: PADinfo@cornell.edu
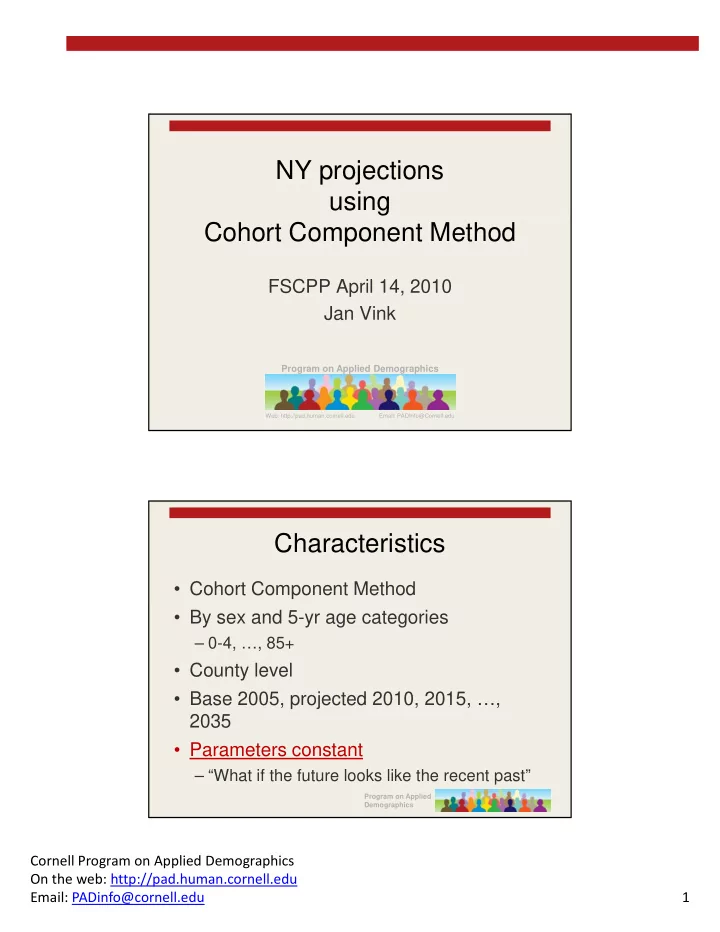
NY projections using Cohort Component Method
FSCPP April 14, 2010 Jan Vink
Program on Applied Demographics
Web: http://pad.human.cornell.edu Email: PADInfo@Cornell.edu
Characteristics
- Cohort Component Method
- By sex and 5-yr age categories
– 0-4, …, 85+
- County level
- Base 2005, projected 2010, 2015, …,
Program on Applied Demographics
2035
- Parameters constant