Outline Performance Optimization of Component-based Data Intensive - - PDF document

outline performance optimization of component based data
SMART_READER_LITE
LIVE PREVIEW

Outline Performance Optimization of Component-based Data Intensive - - PDF document

Outline Performance Optimization of Component-based Data Intensive Motivation Applications Approach Optimization Group Instances Alan Sussman Optimization Transparent Copies Michael Beynon Ongoing Work Tahsin Kurc


slide-1
SLIDE 1

1

Performance Optimization of Component-based Data Intensive Applications

Alan Sussman Michael Beynon Tahsin Kurc Umit Catalyurek Joel Saltz

University of Maryland http://www.cs.umd.edu/projects/adr

Alan Sussman (als@cs.umd.edu) 2

Outline

Motivation Approach Optimization – Group Instances Optimization – Transparent Copies Ongoing Work

Alan Sussman (als@cs.umd.edu) 3

Targeted Applications

Pathology Volume Rendering Surface Groundwater Modeling Satellite Data Analysis

Alan Sussman (als@cs.umd.edu) 4

Runtime Environment

Heterogeneous Shared Resources:

Host level: machine, CPUs, memory, disk storage Network connectivity

Many Remote Datasets:

Inexpensive archival storage clusters (1TB ~ $10k) Islands of useful data Too large for replication
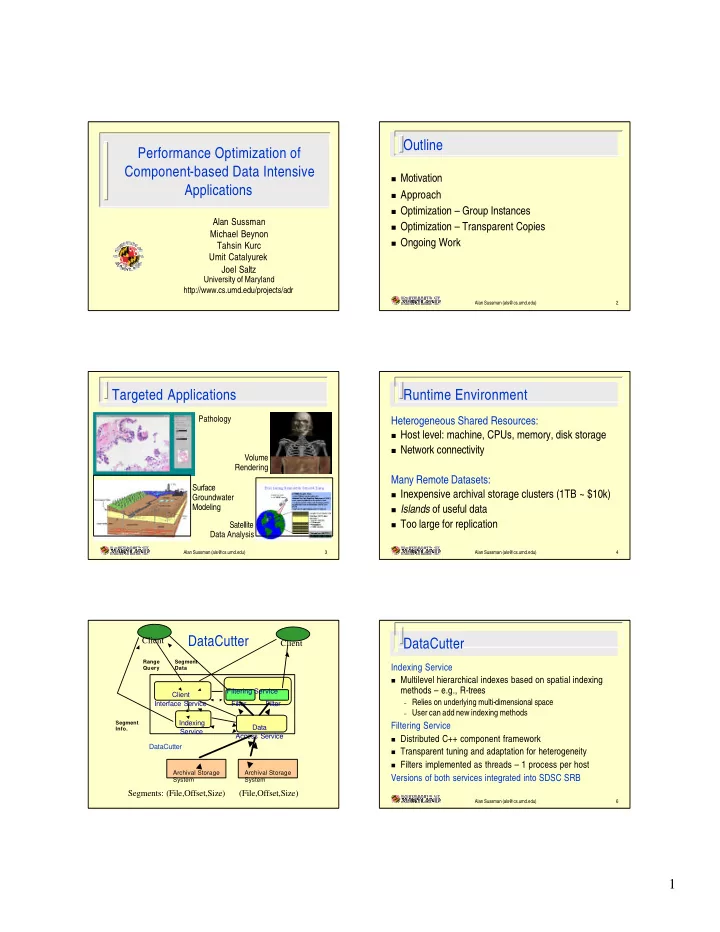
Client Client

Archival Storage System

Range Query Segment Info. Segment Data

Indexing Service Client Interface Service Data Access Service DataCutter Filter Filter Filtering Service

Archival Storage System

Segments: (File,Offset,Size) (File,Offset,Size)

DataCutter

Alan Sussman (als@cs.umd.edu) 6

DataCutter

Indexing Service

Multilevel hierarchical indexes based on spatial indexing

methods – e.g., R-trees

– Relies on underlying multi-dimensional space – User can add new indexing methods

Filtering Service

Distributed C++ component framework Transparent tuning and adaptation for heterogeneity Filters implemented as threads – 1 process per host

Versions of both services integrated into SDSC SRB

slide-2
SLIDE 2

2

Alan Sussman (als@cs.umd.edu) 7

Indexing - Subsetting

Datasets are partitioned into segments

– used to index the dataset, unit of retrieval – Spatial indexes built from bounding boxes of all

elements in a segment

Indexing very large datasets

– Multi-level hierarchical indexing scheme – Summary index files -- for a collection of segments or

detailed index files

– Detailed index files -- to index the individual segments

Alan Sussman (als@cs.umd.edu) 8

Filter-Stream Programming (FSP)

Purpose: Specialized components for processing data

based on Active Disks research

[Acharya, Uysal, Saltz: ASPLOS’98],

dataflow, functional parallelism, message passing.

filters – logical unit of computation

high level tasks

init,process,finalize interface

streams – how filters communicate

unidirectional buffer pipes

uses fixed size buffers (min, good)

manually specify filter connectivity

and filter-level characteristics

Extract ref Extract raw 3D reconstruction View result Raw Dataset Reference DB Alan Sussman (als@cs.umd.edu) 9

Placement

The dynamic assignment of filters to particular hosts

for execution is placement(or mapping)

Optimization criteria:

– Communication

leverage filter affinity to dataset minimize communication volume on slower connections co-locate filters with large communication volume

– Computation

expensive computation on faster, less loaded hosts Alan Sussman (als@cs.umd.edu) 10

FSP: Abstractions

Filter Group

logical collection of filters to use together

application starts filter group instances

Unit-of-work cycle

“work” is application defined (ex: a query)

work is appended to running instances

init(), process(), finalize() called for each work

process() returns { EndOfWork | EndOfFilter }

allows for adaptivity A B

uow 0 uow 1 uow 2 buf buf buf buf

S

Alan Sussman (als@cs.umd.edu) 11

Optimization - Group Instances

Work host3 (2 cpu) host2 (2 cpu) host1 (2 cpu)

P0 F0 C0 P1 F1 C1

Match # instances to environment (CPU capacity, network)

Alan Sussman (als@cs.umd.edu) 12

Experiment - Application Emulator

Parameterized dataflow filter

– consume from all inputs – compute – produce to all outputs

Application emulated:

– process 64 units of work – single batch

in

  • ut
  • ut

process Filter

P F C

slide-3
SLIDE 3

3

Alan Sussman (als@cs.umd.edu) 13

Instances: Vary Number, Application

Setup: UMD Red Linux cluster (2 processor PII 450 nodes) Point: # instances depends on application and environment

Number of Filter Group Instances

1 2 4 8 16 32 64

Response Time (sec)

50 100 150 200 250 300 350 400 450 min mean max

Number of Filter Group Instances

1 2 4 8 16 32 64

Response Time (sec)

5 10 15 20 25 30 35 40 min mean max

I/O Intensive CPU Intensive

Alan Sussman (als@cs.umd.edu) 14

Group Instances (Batches)

Work issued in instance batches until all complete. Matching # instances to environment (CPU capacity)

Batch 1 host3 (2 cpu) host2 (2 cpu) host1 (2 cpu)

P0 F0 C0 P1 F1 C1

Batch 2 Batch 0 Batch 0

Alan Sussman (als@cs.umd.edu) 15

Instances: Vary Number, Batch Size

Setup: (Optimal) is lowest all time Point: # instances depends on application and environment

CPU Intensive

Number of Filter Group Instances

1 2 4 8 16

Response Time (sec)

50 100 150 200 250 300 350 400 450 min mean max all

Batch Size (Optimal Num Instances)

1 (8) 2 (32) 4 (8) 8 (4) 16 (4) 32 (2) 64 (1)

Response Time (sec)

50 100 150 200 250 300 350 400 450 min mean max all

Alan Sussman (als@cs.umd.edu) 16

Adding Heterogeneity

Work hostSMP (8 cpu) host2 (2 cpu) host1 (2 cpu)

P0 F0 C0 P3 F3 C3

host1 (2 cpu) host2 (2 cpu)

P4 F4 C4 P7 F7 C7

Alan Sussman (als@cs.umd.edu) 17

Optimization - Transparent Copies

FSP Abstraction

replicate individual filters transparent

– work-balance among copies – better tune resources to actual filter needs

Provide “single-stream” illusion

– Multiple producers and consumers, deadlock, flow control – Invariant: UOWi < UOWi+1

Problem: filter state

R E Ra0 M Rak

Alan Sussman (als@cs.umd.edu) 18

Runtime Workload Balancing

Use local information:

– queue size, send time / receiver acks

Adjust number of transparent copies Demand based dataflow (choice of consumer)

– Within a host – perfect shared queue among copies – Across hosts

Round Robin Weighted Round Robin Demand-Driven sliding window (on buffer consumption rate) User-defined

slide-4
SLIDE 4

4

Alan Sussman (als@cs.umd.edu) 19

Experiment – Virtual Microscope

Client-server system for interactively visualizing digital slides

Image Dataset (100MB to 5GB per focal plane) Rectangular region queries, multiple data chunk reply

Hopkins Linux cluster

– 4 1-processor, 1 2-processor PIII-800, 2 80GB IDE disks, 100Mbit Ethernet

Decompress filter is most expensive, so good candidate for

replication

50 queries at various magnifications, 512x512 pixel output

zoom view read data decompress clip

Alan Sussman (als@cs.umd.edu) 20

Virtual Microscope Results

4.60 1.27 0.62 0.37 1.49 h-g-g-g-g 50x 100x 200x 400x Average 3.24 0.92 0.45 0.33 1.08 g-g(2)-g-g-g 4.46 1.26 0.58 0.33 1.44 g-g-g-g-g 5.34 1.27 0.68 0.45 1.68 h-g(2)-g(2)-b-b 3.50 0.96 0.50 0.39 1.17 h-g(4)-g(2)-g-g 3.43 0.95 0.49 0.37 1.15 h-g(2)-g(2)-g-g 3.41 0.95 0.50 0.39 1.15 h-g(2)-g-g-g 6.95 1.73 0.73 0.38 2.10 h-h-h-h-h Response Time (seconds) R-D-C-Z-V

Alan Sussman (als@cs.umd.edu) 21

Experiment - Isosurface Rendering

UT Austin ParSSim species transport simulation

Single time step visualization, read all data

Setup: UMD Red Linux cluster (2 processor PII 450 nodes)

read dataset isosurface extraction shade + rasterize merge / view R E Ra M

1.5 GB 38.6 MB 11.8 MB 28.5 MB 0.64s 4.3% 1.64s 11.2% 11.67s 79.5% 0.73s 5.0% = 14.68s (sum) = 12.65s (time)

Alan Sussman (als@cs.umd.edu) 22

Sample Isosurface Visualization

V = 0.35 V = 0.7

Alan Sussman (als@cs.umd.edu) 23

Transparent Copies: Replicate Raster

5.70s (22%) 7.32s 2 nodes 3.00s 12.18s 1 copy of Raster 3.24s (– 8%) 8.16s (33%) 2 copies

  • f Raster

8 nodes 1 node 3.88s (7%) 4.17s 4 nodes

Setup: SPMD style, partitioned input dataset per node Point: copies of bottleneck filter enough to balance flow

Alan Sussman (als@cs.umd.edu) 24

Experiment – Resource Heterogeneity

Isosurface rendering on Red, Blue, Rogue Linux clusters at

Maryland

– Red – 16 2-processor PII-450, 256MB, 18GB SCSI disk – Blue –8 2-processor PIII-550, 1GB, 2-8GB SCSI disk +

1 8-processor PIII-450, 4GB, 2-18GB SCSI disk

– Rogue – 8 1-processor PIII-650, 128MB, 2-75GB IDE disks – Red, Blue connected via Gigabit Ethernet, Rogue via 100Mbit

Ethernet

Two implementations of Raster filter – z-buffer and active

pixels (the one used in previous experiment)

slide-5
SLIDE 5

5

Alan Sussman (als@cs.umd.edu) 25

Experimental setup

read dataset isosurface extraction shade + rasterize merge / view R E Ra M

1.5 GB 38.6 MB 11.8 MB 28.5 MB 0.64s 0.68s 1.64s 1.65s 11.67s 9.43s 0.73s 0.90s = 14.68s = 12.66s Active Pixel Z-buffer 32.0MB Active Pixel Z-buffer Experiment to follow combines R and E filters, since that showed best performance in experiments not shown

Alan Sussman (als@cs.umd.edu) 26

Varying number of nodes

19.0 20.8 10.7 11.5

8 nodes

9.3 8.9 11.3 7.9

2 nodes

10.5 11.7 7.7 7.9

4 nodes

2.6 3.2 2.9 3.0

8 nodes

7.7 5.7 12.7 7.3

2 nodes

3.2 3.9 4.8 4.2

4 nodes

2(0) 2(2) 1(0) 1(1) #Ra n/a 8.6 n/a 8.2 RE-Ra-M n/a 10.7 n/a 12.2 RE-Ra-M

1 node 1 node

Configuration Z-buffer Rendering Active Pixel Rendering

Only Red nodes used – each one runs 1 RE, 0, 1, or 2 RA, and one runs M

Alan Sussman (als@cs.umd.edu) 27

Heterogeneous nodes

Active Pixel algorithm on 8-processor Blue node + Red data nodes Blue node runs 7 Ra or ERacopies and M, Red nodes each run 1 of each except M 4.2 3.7 4.0 4.1 4.1 5.1 4.0 4.1 6.5 4.2 4.0 8.2 R- ERa-M 3.8 2.9 3.8 3.5 3.0 4.4 3.0 2.6 5.7 3.0 3.0 7.3 RE- Ra-M DD WRR RR DD WRR RR DD WRR RR DD WRR RR

8 data nodes 4 data nodes 2 data nodes 1 data node

Conf.

Alan Sussman (als@cs.umd.edu) 28

Skewed data distribution

Experimental setup

– 25GB dataset from UT ParSSim (bigger grid than earlier

experiments)

– Hilbert curve declustering onto disks on 2 Blue, 2 Rogue

nodes

– Skew moves part of data from Blue to Rogue nodes

Alan Sussman (als@cs.umd.edu) 29

Skewed data distribution

Balanc e d#

  • #

Ac tive # Pixe l# R e nde ring 5 1 0 1 5 2 0 2 5 3 0 R E Ra -M R-ERa-M RE-R a -M Fi lte r# Co n f ig u ration Exec u t io n # Time # (s ec on d s) RR W RR DD S k e w e d# 25%#

  • #

Ac tive # Pixel# Re nde r i ng 5 1 0 1 5 2 0 2 5 3 0 RERa-M R

  • ERa -

M RE

  • Ra- M

F ilter#Con figu ratio n Exe cu ti

  • n #

Time # (s ec on d s ) R R W RR D D Ske w e d# 5 0 % #

  • #

A c tiv e # Pi x e l# Re nde r ing 5 1 0 1 5 2 0 2 5 3 0 R E Ra -M R-ERa-M RE-R a -M Fi lte r# Co n f ig u ration Ex ec u tion #T im e#(se co n d s ) RR W RR DD Ske we d# 75 %#

  • #

Ac tive # Pix e l# Re nde ring 5 1 0 1 5 2 0 2 5 3 0 RERa-M R

  • ERa -

M RE

  • Ra- M

F ilter#Con figu ratio n Exe cu ti

  • n #T

ime # (s ec on d s ) R R W RR D D

Alan Sussman (als@cs.umd.edu) 30

Experimental Implications

Multiple group instances

– Higher utilization of under-used resources – Reduce application response time – but … requires work co-execution tolerance

Transparent copies can help

– Most filter decompositions are unbalanced – Heterogeneous CPU capacity / load – but … requires buffer out-of-order tolerance

slide-6
SLIDE 6

6

Alan Sussman (als@cs.umd.edu) 31

Ongoing and Future Work

Ongoing and Future work

– Automated placement, instances, transparent copies – predictive (cost models) – adaptive (work feedback) – Filter accumulator support (partitioning, replication) – Java filters – CCA-compliant filters – Very large datasets – including HDF5 format – Using storage clusters at UMD and OSU, then

testbed at LLNL