
SLIDE 1
Page 1 Assignment for Tues
- Read “Getting the Least out of Your C
Compiler” – linked to course web page
Last Time
- Looked at ColdFire and ARM in depth
Today
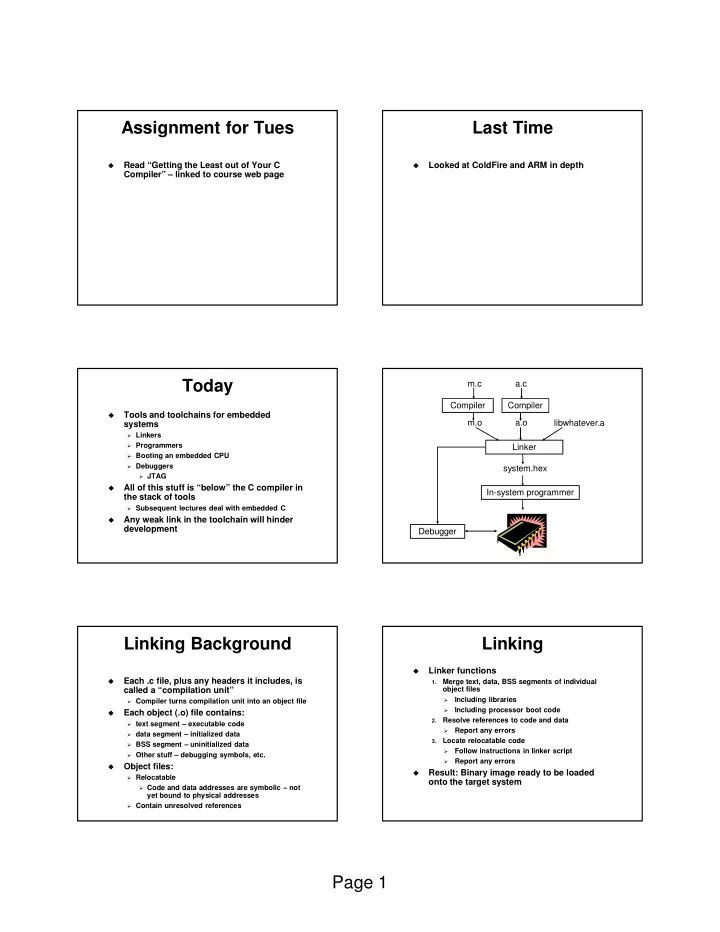
- Tools and toolchains for embedded
systems
Linkers Programmers Booting an embedded CPU Debuggers JTAG
- All of this stuff is “below” the C compiler in
the stack of tools
Subsequent lectures deal with embedded C
- Any weak link in the toolchain will hinder
development Compiler m.c m.o Compiler a.c a.o Linker In-system programmer libwhatever.a system.hex Debugger
Linking Background
- Each .c file, plus any headers it includes, is
called a “compilation unit”
Compiler turns compilation unit into an object file
- Each object (.o) file contains:
text segment – executable code data segment – initialized data BSS segment – uninitialized data Other stuff – debugging symbols, etc.
- Object files:
Relocatable Code and data addresses are symbolic – not
yet bound to physical addresses
Contain unresolved references
Linking
- Linker functions
1.
Merge text, data, BSS segments of individual
- bject files
- Including libraries
- Including processor boot code
2.
Resolve references to code and data
- Report any errors
3.
Locate relocatable code
- Follow instructions in linker script
- Report any errors
- Result: Binary image ready to be loaded
- nto the target system