PIN Dynamic instrumentation framework PIN: Building Customized - - PDF document

pin
SMART_READER_LITE
LIVE PREVIEW

PIN Dynamic instrumentation framework PIN: Building Customized - - PDF document

PIN Dynamic instrumentation framework PIN: Building Customized Goals: Program Analysis Tools with Easy-to-use Dynamic Instrumentation Portable Transparent Luk et al PLDI 2005 Efficient Presented by Godmar Back


slide-1
SLIDE 1

1

PIN: Building Customized Program Analysis Tools with Dynamic Instrumentation

Presented by Godmar Back Luk et al PLDI 2005

1/23/2007 CS 6304 Spring 2007 2

PIN

  • Dynamic instrumentation framework
  • Goals:

– Easy-to-use – Portable – Transparent – Efficient – Robust

1/23/2007 CS 6304 Spring 2007 3
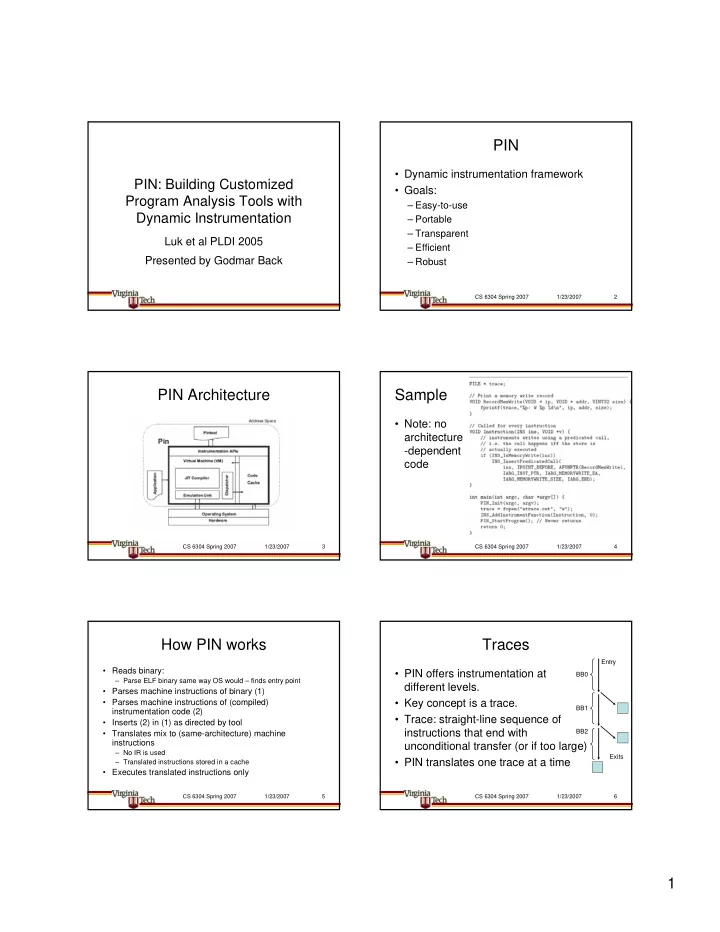
PIN Architecture

1/23/2007 CS 6304 Spring 2007 4

Sample

  • Note: no

architecture

  • dependent

code

1/23/2007 CS 6304 Spring 2007 5

How PIN works

  • Reads binary:

– Parse ELF binary same way OS would – finds entry point

  • Parses machine instructions of binary (1)
  • Parses machine instructions of (compiled)

instrumentation code (2)

  • Inserts (2) in (1) as directed by tool
  • Translates mix to (same-architecture) machine

instructions

– No IR is used – Translated instructions stored in a cache

  • Executes translated instructions only

1/23/2007 CS 6304 Spring 2007 6

Traces

  • PIN offers instrumentation at

different levels.

  • Key concept is a trace.
  • Trace: straight-line sequence of

instructions that end with unconditional transfer (or if too large)

  • PIN translates one trace at a time

Entry Exits BB0 BB1 BB2

slide-2
SLIDE 2

2

1/23/2007 CS 6304 Spring 2007 7

Instrumentation Levels

  • By default instrumentation done by trace
  • Provides “by instrumentation” – implemented as

convenience only for (b : basicblocks) { for (i : instructions(b)) { …. }}

  • Routine:

– Add instrumentation once a routine is entered

  • Image:

– Perform some instrumentation when an image is loaded (executable, .so file, etc.)

1/23/2007 CS 6304 Spring 2007 8

Techniques (1): Trace Linking

  • When a trace ends

– Examples:

  • virtual method dispatch: jmp *eax
  • Function call return

– First time, return to VM, examine where it ended and where it goes, translate subsequent trace. – Second time, would like to jump directly to successor trace if at all possible

  • Easy if ends with direct jump
  • Need prediction if it ends with indirect jump

1/23/2007 CS 6304 Spring 2007 9

Trace Linking (cont’d)

  • Q.: what is the
  • verhead

in number of instructions?

1/23/2007 CS 6304 Spring 2007 10

Cloning & Trace Linking

  • Q. Why do

we still need a mis- prediction check here?

1/23/2007 CS 6304 Spring 2007 11

Register Reallocation

  • Virtual vs. physical registers

– “Virtual registers” are machine registers (%EAX, %EBX, etc.) as seen by the application program’s compiler – “Physical registers” are the ones holding the actual values during the execution of translated code

  • Must map virtual to physical

– Must guarantee that life virtual registers are not destroyed; spill to memory if needed.

  • Register allocation problem!

1/23/2007 CS 6304 Spring 2007 12

Register Allocation

  • Traditional approach:

– Build CFG. Do Liveness analysis. Compute interference graph. Color it. Assign registers – Won’t work here because entire CFG is not known – it’s incrementally built.

  • Alternative:

– Linear-scan register assignment

slide-3
SLIDE 3

3

1/23/2007 CS 6304 Spring 2007 13

Linear Scan Allocation [Poletto’99]

  • Idea:

– Determine live ranges – Range defined as instruction index – Assign registers greedily – When spilling, spill the one with the farthest end range

  • Q.: What is the heuristics?

Assume: 2 physical registers A A, B B, D D,E D

1/23/2007 CS 6304 Spring 2007 14

Register Reallocation (cont’d)

  • When linking traces, would like to avoid

rearranging registers: thus, on code cache miss, jit target trace with v-to-p mapping that origin trace ended with.

  • Second time around (if target trace is

reached from different origin):

– need compensation code

  • By comparison: valgrind always spills all

virtual registers to memory

1/23/2007 CS 6304 Spring 2007 15

Register Reconciliation (1)

1/23/2007 CS 6304 Spring 2007 16

Register Reconciliation (2)

1/23/2007 CS 6304 Spring 2007 17

Register Reconciliation (3)

EBX is thread-local Location (optimized for single-threaded case)

1/23/2007 CS 6304 Spring 2007 18

Other Optimizations

  • Inlining vs. Bridging
  • Big question: when to inline (will examine
  • n Thursday)
  • Inlining optimization:

– Can avoid saving caller-saved registers blindly (including eflags) – why?

slide-4
SLIDE 4

4

1/23/2007 CS 6304 Spring 2007 19

Performance Analysis

  • What counts is overhead/slowdown.

– How much is acceptable? 120%? 200%? 2000%?

  • Must know NULL-tool overhead/baseline

slowdown

  • Obviously, tool overhead depends on tool

– How much work is done in tool code (in common path?) – How efficient is bridging code/how often could inlining be applied?

1/23/2007 CS 6304 Spring 2007 20

NULL-tool overhead

1/23/2007 CS 6304 Spring 2007 21

NULL-tool: PIN vs Competition

1/23/2007 CS 6304 Spring 2007 22

Count-BB Tool

1/23/2007 CS 6304 Spring 2007 23

BB-tool: PIN vs Competition

1/23/2007 CS 6304 Spring 2007 24

Applications

  • Only few at the time PIN was published;

many more now, see http://rogue.colorado.edu/pin

  • Mainly used in architecture community so

far

– Cache simulation, program phase analysis, etc.

  • Top
slide-5
SLIDE 5

5

1/23/2007 CS 6304 Spring 2007 25

PIN Goals Revisited

  • Easy-to-use

– Yes, but little support for accessing internals (e.g. liveness ranges etc.); little support for accessing symbolic information

  • Portable

– Yes: four architectures, 3 OS

  • Transparent

– Almost completely (minus address space effects)

  • Efficient

– According to their benchmarks for simple codes

  • Robust

– In my experience, pretty robust

Discussion/Questions