
SLIDE 1
2/19/2011 1
The effect of Ethanol
- Various solid state
composition
- Depends on the spray dry
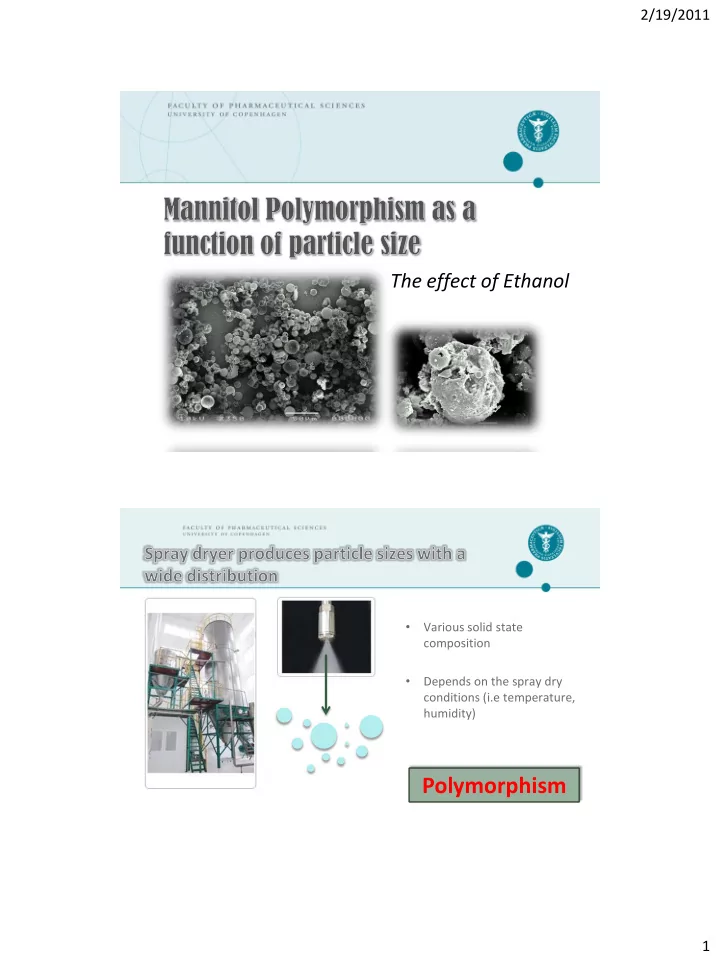
Polymorphism 1 2/19/2011 Aims Assess if polymorphic change - - PDF document
2/19/2011 The effect of Ethanol Various solid state composition Depends on the spray dry conditions (i.e temperature, humidity) Polymorphism 1 2/19/2011 Aims Assess if polymorphic change follows the trend linked to the particle
MATERIALS
α,β,δ and hemihydrate
DATA INTERPRE- TATION Identify polymrphic change according to particle size
Raman Microscopy CHEMO-METRICS Multivariate Data Analysis PLS-DA SPRAY DRY Mannitol in 10% Ethanol
NGI Separate to different particle size fractions (Stage 1 – Stage 8)
SOLID STATE ANALYSIS Characterize mannitol polymophrs
X-RAY Diffracto- metry Scanning Electron Micrograph / Thermogravi- metric Analysis
5 10 15 20 25 30 35 40
Offset Y values 2 Theta S78 S6 S5 S4 S3 S2 S1 Bulk 10% Ethanol
Bulk Stage 1 Stage 2 Stage 3 Stage 4 Stage 5 Stage 6 Stage 7,8
400 600 800 1000 1200 1400 5000 10000 15000 20000 25000 30000
Intensity Wavenumber (cm
alpha mannitol beta mannitol
400 600 800 1000 1200 1400
0.00 0.05 0.10 0.15
Wavenumber (cm
Loading 1, 86.54% Loading 2, 13.15% Loading 3, 0.25%
S 1 S 2 S 3 S 4 S 5 S 6 S 7 S 8 10 20 30 40 50 60 70 80 90 100
Percentage of beta mannitol (%) NGI stage