Preliminary results from a 15-month open-label extension (OLE) study - - PowerPoint PPT Presentation

preliminary results from a 15 month open label extension
SMART_READER_LITE
LIVE PREVIEW

Preliminary results from a 15-month open-label extension (OLE) study - - PowerPoint PPT Presentation

Preliminary results from a 15-month open-label extension (OLE) study investigating RG6042 huntingtin protein (HTT) antisense oligonucleotide (ASO) in adults with manifest Huntingtons disease (HD) Scott A. Schobel MD, MSc Associate Group


slide-1
SLIDE 1

Preliminary results from a 15-month open-label extension (OLE) study investigating RG6042 huntingtin protein (HTT) antisense oligonucleotide (ASO) in adults with manifest Huntington’s disease (HD)

Scott A. Schobel MD, MSc Associate Group Medical Director

  • F. Hoffmann-La Roche Ltd, Basel, Switzerland

1 To access this presentation go to https://bit.ly/2tK3W0D M-XX-00000779

slide-2
SLIDE 2
  • I am a full-time employee of F. Hoffmann-La Roche Ltd
  • The data shown in this talk is from preliminary analyses while database lock is ongoing

Disclosures

2

slide-3
SLIDE 3

Acknowledgements

3

Special thanks for sharing data and for ongoing collaboration: Deepest gratitude to the Phase I/IIa investigator network, study participants (present and future) and their families

Ionis discovered RG6042 and is partnered with Roche for its

  • development. Special thanks to Frank Bennett, Holly Kordasiewicz,

Eric Swayze, Roger Lane and Anne Smith

slide-4
SLIDE 4

RG6042 now has a generic name

Tominersen is an investigational (not approved) medicine that is being studied for the treatment of people with Huntington’s disease. Tominersen has not been approved by the Food and Drug Administration (FDA). The efficacy and safety of tominersen are currently being studied. https://www.who.int/medicines/services/inn/innguidance/en (Accessed February 2019).

4

Tominersen is the international non-proprietary name (generic name) for the investigational molecule most recently referred to as RG6042

slide-5
SLIDE 5

Today’s presentation will focus on preliminary 15-month data from the OLE of the tominersen Phase I/IIa study

HD, Huntington's disease; OLE, open-label extension; PD, pharmacodynamics; PK, pharmacokinetics.

5

Ongoing studies Future

Completed OLE HD Natural History Study Phase III GENERATION HD1

Phase I/IIa CHDI 2018 I/IIa

Exploratory fluid biomarkers PK/PD Safety and tolerability

OLE of the Phase I/IIa study Today: preliminary 15-month data (N=43 of 46)

slide-6
SLIDE 6

HTT-lowering therapies may slow or stop clinical progression

* Toxic mHTT=HTT 36+ CAG repeats. ASO, antisense oligonucleotide; HTT, huntingtin gene; HTT, huntingtin protein; mHTT, mutant HTT; MoA, mechanism of action; SOC, standard of care. Wild EJ, Tabrizi SJ. Lancet Neurol. 2017; 16:837–847; Bates GP, et al. Nat Rev Dis Primers. 2015; 1:15005; Ross CA, et al. Nat Rev Neurol. 2014; 10:204–216; Roos R. Orphanet J Rare Dis. 2010; 20:5:40; Zuccato C, et al. Physiol Rev. 2010; 90:905–981; Zielonka D, et al. Front Physiol. 2014; 5:380.

6

Toxic mHTT*

Cause

  • f disease

RNase H-mediated degradation ASO

MoA schema adapted from Wild and Tabrizi, Lancet Neurology. 2017

DNA pre-mRNA Nucleus mRNA

ASO

Cellular dysfunction

Impaired axonal transport Transcriptional deregulation Proteasome inhibition Excitotoxicity Mitochondrial dysfunction Synaptic dysfunction Neuronal dysfunction and death Caspase/protease activation

HTT-lowering therapies generally target upstream pathogenic principles Roche/Ionis ASO suppresses causal toxic protein (non-allele selective) Other current SOC and advanced clinical development candidates target downstream effects likely addressing few

  • r single domains

Clinical pathological domains

Atrophy

  • Brain tissue loss
  • Muscle wasting
  • Weight loss

Speech and swallowing Cognitive and behavioural

  • Psychomotor slowing
  • Executive dysfunction
  • Apathy
  • Irritability

Motor

  • Coordination
  • Balance/gait
  • Chorea
  • Progressive akinesia
slide-7
SLIDE 7

In vivo preclinical data were used to define target CSF mHTT reduction

See poster 22 “Development of a non-clinical pharmacokinetic/pharmacodynamic model to predict CSF reductions in huntingtin protein in individuals with Huntington’s disease” for more details. CSF, cerebrospinal fluid; HD, Huntington’s disease; HTT, huntingtin protein; KD, knockdown; mHTT, mutant HTT.

  • 1. Kordasiewicz HB, et al. Neuron. 2012; 74:1031–1044; 2. Stanek LM, et al. J Huntingtons Dis. 2013; 2:217–228; 3. Sanwald Ducray P, et al. Neurology. 2019; 92(15 Suppl):S16.005.

7

Transgenic mouse models Cortex ~30–80% Caudate ~30% Target trough human CSF mHTT reduction range: ~30–50% % CSF HTT KD % HTT KD in cortex % HTT KD in caudate 20–30 30–55 5–20 30–40 40–70 15–35 40–50 55–80 25–45 Cyno tissue/CSF–HTT relationship Tissue to CSF3 CSF3 Tissue lowering to efficacy1,2 CSF mHTT lowering of ~20–30% at trough meets observed cortical threshold of efficacy in preclinical models of HD; caudate lowering is only covered at higher levels of CSF reduction (e.g. >30%)1–3 Based on preclinical evidence, a CSF mHTT lowering of 30–50% is expected to be associated with broad therapeutic benefits2

slide-8
SLIDE 8

In 2018, the results of the first-in-human Phase I/IIa study of tominersen (HTT-targeting ASO) were presented at CHDI

Photo (top) credit: Gene Veritas. ASO, antisense oligonucleotide; HTT, huntingtin gene.

8

slide-9
SLIDE 9

In the Phase I/IIa trial, tominersen treatment produced dose-dependent reductions in CSF mHTT

* Nominal p values from prespecified analysis of key exploratory endpoint.2 † Endpoint is defined as the later of Day 85 or 113. Day 113 and 141 samples were each performed in randomised subsets of patients, indicated by dotted lines. CSF, cerebrospinal fluid; mHTT; mutant huntingtin protein; NS, not significant.

  • 1. Tabrizi SJ, et al. N Engl J Med. 2019; 380:2307–2316; 2. Tabrizi SJ, et al. Neurology. 2018; 19(15 Suppl):CT.002.

9

mHTT percentage change from baseline to trough after three or four monthly doses1*

CSF mHTT at endpoint† (% change from baseline)

–80 –60 –40 –20 20 40 60 80 Placebo 10 mg 30 mg 60 mg 90 mg 120 mg NS p=0.01 p=0.02 p<0.01 p<0.01

CSF mHTT lowering of 40–60% was observed after four highest doses in the Phase I/IIa study1 CSF mHTT trendline was still decreasing in the Phase I/IIa study1 Tominersen was generally well tolerated over 4 monthly doses1

mHTT percentage change over time1

Day CSF mHTT ‡ (% change from baseline)

60 40 20 –20 –40 –60 29 57 85 113 141 Placebo 10 mg 30 mg 60 mg 90 mg 120 mg Dose

slide-10
SLIDE 10

Tominersen’s Clinical Development Programme is contributing further data to evaluate the efficacy and safety of the drug

* An additional 8 patients may be included to allow investigation of additional dose levels and repeat doses if necessary. CSF, cerebrospinal fluid; HD, Huntington's disease; OLE, open-label extension; PD, pharmacodynamics; PK, pharmacokinetics.

  • 1. Tabrizi SJ, et al. N Engl J Med. 2019; 380:2307–2316; 2. Clinicaltrials.gov/show/NCT03342053 (Accessed February 2020);
  • 3. Clinicaltrials.gov/show/NCT03664804 (Accessed February 2020); 4. Clinicaltrials.gov/show/NCT03761849 (Accessed February 2020);
  • 5. Clinicaltrials.gov/show/NCT03842969 (Accessed February 2020); 6. Clinicaltrials.gov/show/NCT04000594 (Accessed February 2020).

10

Clinical Development Programme

GEN-PEAK N=12*6

  • PK/PD in CSF and plasma
  • Manifest HD patients
  • 7 months including follow-up

Open-Label Extension N=462

  • Long-term safety, tolerability, PK and PD
  • Early manifest HD patients
  • 15 months

HD Natural History Study N=953

  • Prospective, longitudinal study
  • Early manifest HD patients
  • 15 months

GENERATION HD1 N=8014

  • Pivotal, long-term efficacy and safety
  • Manifest HD patients
  • 25 months (plus follow-up)

GEN-EXTEND5 (OLE)

Includes digital monitoring platform Ongoing, recruitment complete Ongoing, recruiting

Complete

Phase I/IIa1 N=46

  • First-in-human study
  • Safety, tolerability, PK and PD
  • Early manifest HD patients

✓ ✓

Complete, final analysis ongoing

slide-11
SLIDE 11

Tominersen’s Clinical Development Programme is contributing further data to evaluate the efficacy and safety of the drug

* An additional 8 patients may be included to allow investigation of additional dose levels and repeat doses if necessary. CSF, cerebrospinal fluid; HD, Huntington's disease; OLE, open-label extension; PD, pharmacodynamics; PK, pharmacokinetics.

  • 1. Tabrizi SJ, et al. N Engl J Med. 2019; 380:2307–2316; 2. Clinicaltrials.gov/show/NCT03342053 (Accessed February 2020);
  • 3. Clinicaltrials.gov/show/NCT03664804 (Accessed February 2020); 4. Clinicaltrials.gov/show/NCT03761849 (Accessed February 2020);
  • 5. Clinicaltrials.gov/show/NCT03842969 (Accessed February 2020); 6. Clinicaltrials.gov/show/NCT04000594 (Accessed February 2020).

11

Clinical Development Programme

GEN-PEAK N=12*6

  • PK/PD in CSF and plasma
  • Manifest HD patients
  • 7 months including follow-up

Open-Label Extension N=462

  • Long-term safety, tolerability, PK and PD
  • Early manifest HD patients
  • 15 months

HD Natural History Study N=953

  • Prospective, longitudinal study
  • Early manifest HD patients
  • 15 months

GENERATION HD1 N=8014

  • Pivotal, long-term efficacy and safety
  • Manifest HD patients
  • 25 months (plus follow-up)

GEN-EXTEND5 (OLE)

Includes digital monitoring platform

Phase I/IIa1 N=46

  • First-in-human study
  • Safety, tolerability, PK and PD
  • Early manifest HD patients

Ongoing, recruitment complete Ongoing, recruiting

Complete

Complete, final analysis ongoing

slide-12
SLIDE 12

Design of the open-label extension (OLE) of the Phase I/IIa study

* At the time of the data cut-off (18 July 2019) 43 out of the 46 patients had reached the 15-month visit timepoint (Q4W: n=22, Q8W: n=21), three patients were enrolled in the study 3 months after all other study participants and the 15-month visit had not been conducted at time of data cut-off. CSF, cerebrospinal fluid; HD, Huntington’s disease; IT, intrathecal; mHTT, mutant huntingtin protein; NHS, Natural History Study; PD, pharmacodynamics; PK, pharmacokinetics; Q4W, every month; Q8W, every 2 months. Clinicaltrials.gov/show/NCT03342053 (Accessed February 2020).

12

Objective: Replicate and extend understanding of tominersen effects over longer follow-up and gain information earlier than otherwise possible from traditional Phase II study Key study features

  • Early manifest HD patients
  • Participated in Phase I/IIa study
  • Randomised to more vs less frequent

regimen (all participants receive active drug open label)

N=46*

Long-term safety, tolerability, PK and PD of 120 mg tominersen in more vs less frequent regimen to confirm pivotal dose selection and optimise patient convenience

  • Well-tolerated dose with sufficient, sustained effect on CSF mHTT within target range
  • Exploration of fluid and digital biomarkers and standard clinical outcome measures

*

Countries: Canada, Germany, UK (9 sites) Prespecified 9-month interim analysis

*

slide-13
SLIDE 13

Baseline characteristics of all 46 patients of the OLE study

At the time of the data cut-off (18 July 2019) 43 out of the 46 patients had reached the 15-month visit timepoint (Q4W: n=22, Q8W: n=21), three patients were enrolled in the study 3 months after all

  • ther study participants and the 15-month visit had not been conducted at time of data cut-off.

BMI, body mass index; CAP, CAG-age product; HD, Huntington’s disease; OLE, open-label extension; Q4W, every month; Q8W, every 2 months; SD, standard deviation.

13

Characteristics 120 mg tominersen Q4W (N=23) Q8W (N=23) Age (years) mean (SD), range 47.7 (9.3), 30–64 49.5 (11.3), 28–67 Gender male/female (n) 15/8 13/10 CAG repeats mean (SD), range 44.1 (3.1), 40–55 44.4 (3.1), 40–52 CAP score mean (SD), range 477 (66.5), 363–640 504 (55.6), 374–588 HD Stage I/II (n) 17/6 17/6 BMI (kg/m2) mean (SD), range 25.5 (3.0), 18.5–30.8 22.0 (2.6), 15.7–26.4

slide-14
SLIDE 14

Sustained lowering of CSF mHTT was observed in both arms at 15 months (preliminary analysis)

Data points represent mean values and error bars represent 1 standard deviations of the full intent-to-treat population. At the time of the data cut-off (18 July 2019) 43 out of the 46 patients had reached the 15-month visit timepoint (Q4W: n=22, Q8W: n=21), three patients were enrolled in the study 3 months after all

  • ther study participants and the 15-month visit had not been conducted at time of data cut-off.

BL, baseline; CSF, cerebrospinal fluid; mHTT, mutant huntingtin protein; Q4W, every month; Q8W, every 2 months. 1. Tabrizi SJ, et al. N Engl J Med. 2019; 380:2307–2316.

14

  • Pharmacologically relevant CSF mHTT lowering was observed in both treatment arms
  • Data show that Q8W dosing is sufficient to reach target CSF mHTT reductions

Q4W (N=23) 70% mean trough lowering at 15 months Q8W (N=23) 44% mean trough lowering at 15 months

  • 100
  • 90
  • 80
  • 70
  • 60
  • 50
  • 40
  • 30
  • 20
  • 10

BL 85 169 253 337 421

  • 100
  • 90
  • 80
  • 70
  • 60
  • 50
  • 40
  • 30
  • 20
  • 10

BL 85 169 253 337 421 CSF mHTT change from baseline (%) Visit day Visit day Target range

23 23 23 23 23 22 23 22 22 21 19 19 16 19 17 18 n= 23 23 2 23 23 22 22 23 22 21

Phase I/IIa tominersen 120 mg Q4W1 CSF mHTT change from baseline (%)

slide-15
SLIDE 15

Sustained lowering of CSF mHTT was observed in both arms at 15 months (preliminary analysis)

Data points represent mean values and error bars represent 1 standard deviations of the full intent-to-treat population. * Table based on preclinical data. At the time of the data cut-off (18 July 2019) 43 out of the 46 patients had reached the 15-month visit timepoint (Q4W: n=22, Q8W: n=21), three patients were enrolled in the study 3 months after all

  • ther study participants and the 15-month visit had not been conducted at time of data cut-off.

BL, baseline; CSF, cerebrospinal fluid; mHTT, mutant huntingtin protein; Q4W, every month; Q8W, every 2 months. 1. Tabrizi SJ, et al. N Engl J Med. 2019; 380:2307–2316.

15

Q4W (N=23) 70% mean trough lowering at 15 months Q8W (N=23) 44% mean trough lowering at 15 months

  • 100
  • 90
  • 80
  • 70
  • 60
  • 50
  • 40
  • 30
  • 20
  • 10

BL 85 169 253 337 421

  • 100
  • 90
  • 80
  • 70
  • 60
  • 50
  • 40
  • 30
  • 20
  • 10

BL 85 169 253 337 421 CSF mHTT change from baseline (%) Visit day Visit day Target range Phase I/IIa tominersen 120 mg Q4W1 CSF mHTT change from baseline (%) Visit day Visit day

23 23 23 23 23 22 23 22 22 21 19 19 16 19 17 18 n= 23 23 2 23 23 22 22 23 22 21

% CSF HTT KD* % HTT KD in cortex % HTT KD in caudate 20–30 30–55 5–20 30–40 40–70 15–35 40–50 55–80 25–45

slide-16
SLIDE 16

SAFETY AND TOLERABILITY

Tominersen OLE of the Phase I/IIa study

16

slide-17
SLIDE 17

Tominersen 120 mg Q8W appears to be more suitable for chronic dosing than Q4W based upon tolerability and safety

Data cut-off 18 July 2019. *SAE data cut-off 10 January 2020.

† One non-drug related death (completed suicide in patient with a family history of suicide in two members).

AE, adverse event; PI, principal investigator; Q4W, every month; Q8W, every 2 months; SAE, serious AE; SUSAR, suspected unexpected serious adverse reaction.

17

Q4W (N=23)

  • 412 AEs in 23 (100%) of patients

– 86% AEs considered non-drug related – 14% AEs considered drug related

  • 1 patient (4%) discontinued due to AEs
  • 11 patients missed ≥1 dose due to tolerability, patient choice or

PI choice associated with programme transition to less-frequent dosing SAEs*: 7 events in 3 patients non-drug related† 7 events in 2 patients possibly drug related SUSAR: 7 events in 2 patients Severity: 78.9% mild 18.9% moderate 1.7% severe 0.2% life threatening 0.2% fatal†

Q8W (N=23)

  • 209 AEs in 22 (95.7%) of patients

– 98% AEs considered non-drug related – 2% AEs considered drug related

  • 0 patients discontinued due to AEs
  • 1 patient withdrawn due to patient’s decision
  • 1 patient missed 1 dose

SAEs*: 6 events in 3 patients non-drug related 0 possibly drug related SUSAR: None Severity: 80.9% mild 14.8% moderate 4.3% severe 0% life threatening 0% fatal

slide-18
SLIDE 18

No concerning safety laboratory signals with tominersen treatment

ADA, anti-drug antibody; AE, adverse event; ASO, antisense oligonucleotide; NSAID, non-steroidal anti-inflammatory drug; Q4W, every month; Q8W, every 2 months.

18

Potential risk Q4W (N=23) Q8W (N=23)

Thrombocytopenia No AEs reported No trend in lab results No AEs reported No trend in lab results Renal toxicity (i.e. proteinuria, hyponatremia, low serum bicarbonate) 1 AE of proteinuria, resolved without any dose interruption No change in mean serum creatinine over time No AEs reported No change in mean serum creatinine over time Liver 1 AE of hepatic enzyme increase, resolved No patients with persistent lab elevations No AEs reported No patients with persistent lab elevations Immune 8 patients with treatment-induced or boosted anti-drug antibodies (35%) 8 patients with treatment-induced or boosted anti-drug antibodies (35%)

  • 120 mg tominersen treatment (Q4W or Q8W) was not associated with ASO class risks
  • Incidence of treatment-induced or boosted anti-drug antibodies were in line with known ASO class

effects; anti-drug antibodies have been identified for other ASOs, are generally low titre and are not associated with AEs or loss of drug activity

slide-19
SLIDE 19

CSF WBC elevations occurred less frequently with tominersen Q8W vs Q4W

AE, adverse event; CSF, cerebrospinal fluid; Q4W, every month; Q8W, every 2 months; WBC, white blood cell.

19

  • Q8W arm showed fewer elevations in CSF WBCs post-baseline than the Q4W arm
  • CSF WBC changes were not associated with AEs and the pattern of CSF changes was generally

non-sustained

10 20 30 40 50 60 70 100 200 300 400 CSF leukocytes (/μL) Visit day 10 20 30 40 50 60 70 100 200 300 400 CSF leukocytes (/μL) Visit day

23 23 23 23 23 22 23 22 22 21 20 20 17 20 19 19 n= 23 23 2 23 23 23 22 23 22 21

Q4W (N=23) Q8W (N=23)

slide-20
SLIDE 20

CSF total protein elevation occurred less frequently with tominersen Q8W vs Q4W

AE, adverse event; CSF, cerebrospinal fluid; Q4W, every month; Q8W, every 2 months.

20

  • Q8W arm showed fewer elevations in CSF total protein levels post-baseline than the Q4W arm
  • CSF total protein changes were not associated with AEs

100 200 300 400 500 1000 1500 Total CSF protein (g/L) 100 200 300 400 500 1000 1500 Total CSF protein (g/L) Visit day Visit day

Q4W (N=23) Q8W (N=23)

23 23 23 23 23 22 23 22 22 21 20 20 17 20 19 19 n= 23 23 2 23 23 23 22 23 22 21

slide-21
SLIDE 21
  • The Q8W regimen appears better tolerated than the Q4W regimen in terms of number and

nature of AEs and SAEs

  • CSF protein and WBCs are less affected in the Q8W regimen
  • No evidence for ASO-associated class risks in either regimen
  • Overall, these findings suggest that tominersen 120 mg Q8W is more suitable for chronic

dosing paradigms

Safety and tolerability summary

ASO, antisense oligonucleotide; AE, adverse event; CSF, cerebrospinal fluid; Q4W, every month; Q8W, every 2 months; SAE, serious AE; WBC, white blood cell.

21

slide-22
SLIDE 22

CLINICAL PHARMACOLOGY

Tominersen OLE of the Phase I/IIa study

22

slide-23
SLIDE 23

2 4 6 8 10 12 58 116 174 232 290 348 406

Tominersen steady state CSF exposure achieved with Q8W dosing

Data points represent mean values and error bars represent 1 standard deviations. Patients 1002 (1st dose=90 mg), 1004 and 4304 (Q8W with 4 loading doses) and patients with missed doses are excluded. CSF, cerebrospinal fluid; PK, pharmacokinetics; Q4W, every month; Q8W, every 2 months; SD, standard deviation.

23

Mean (±SD) trough CSF concentration over time On visual inspection, tominersen CSF PK steady state was achieved for the Q8W regimen at Month 6 (Day 141)

2 4 6 8 10 12 58 116 174 232 290 348 406 Tominersen CSF concentration (ng/mL) Nominal time (day) Nominal time (day) Tominersen CSF concentration (ng/mL)

Q4W (N=23) Exposure ~5.8 ng/mL Q8W (N=23) Exposure ~1.6 ng/mL

(Initial peak at ~3 ng/mL related to loading regimen)

20 22 21 21 21 20 20 18 18 17 14 14 13 12 12 11 n= 20 21 21 21 21 20 20 20 19

slide-24
SLIDE 24

Similar plasma PK exposure was observed in both Q4W and Q8W

Data points represent mean values and error bars represent 1 standard deviations. Patients 1002 (1st dose=90 mg), 1004 and 4304 (Q8W with 4 loading doses), Day 57 mean for Q8W (n=4) and patients with missed doses are excluded. PK, pharmacokinetics; Q4W, every month; Q8W, every 2 months; SD, standard deviation.

24

Similar plasma exposure at trough in both groups

2 4 6 8 10 12 58 116 174 232 290 348 406

Mean (±SD) trough plasma concentration over time

2 4 6 8 10 12 58 116 174 232 290 348 406 Tominersen plasma concentration (ng/mL) Nominal time (day) Nominal time (day) Tominersen plasma concentration (ng/mL)

Q4W (N=23) Trough expsure ~2.5 ng/mL

19 22 21 21 21 20 20 18 18 17 14 14 13 12 12 11 n= 20 21 19 17 21 18 18 19 17

Q8W (N=23) Trough exposure ~2.4 ng/mL

slide-25
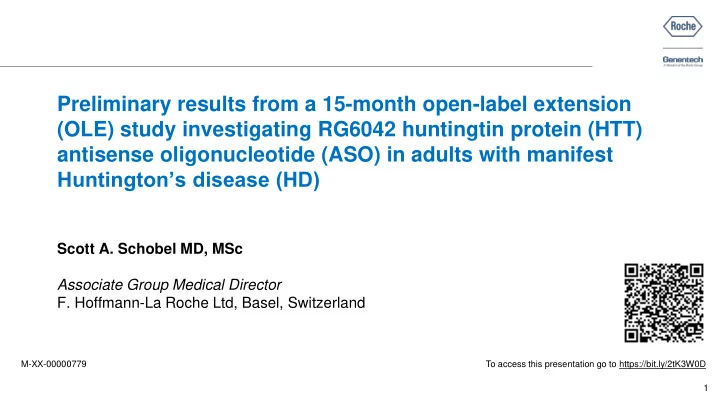
SLIDE 25

Simulation of Q8W and Q16W dosing to achieve pharmacologically relevant effect (120 mg IT) Month mHTT change from baseline (%) –20 –40 6 12 18 21 24 3 15 9

–44%

mHTT % change at trough at steady-state 120 mg Q8W

A clinical population PK/PD model based on Phase I/IIa and OLE data supports programme shift to less frequent dosing

* Q4W dose was verified with VPC and goodness-of-fit plots before simulating Q8W and Q16W.

† Table based on preclinical data.

CSF, cerebrospinal fluid; IT, intrathecal; KD, knockdown; mHTT, mutant huntingtin protein; OLE, open-label extension; PD, pharmacodynamic; PK, pharmacokinetic; popPK/PD, population PK/PD; Q8W, every 2 months; Q16W, every 4 months; VPC, visual predictive check. Sanwald Ducray P, et al. Neurology. 2019; 92(15 Suppl):S16.005.

25

Observed mHTT data (9 months) Observed mHTT data (15 months) Median popPK/PD model predictions 120 mg IT Q8W 25–75% prediction interval 120 mg IT Q8W popPK/PD model predictions 120 mg IT Q16W 25–75% prediction interval 120 mg IT Q16W

120 mg Q8W exceeds trough CSF mHTT preclinical efficacy threshold in cortex and caudate; 120 mg Q16W in cortex only GENERATION HD1 pivotal study dose regimen changed from Q4W/Q8W to Q8W/Q16W –25%

mHTT % change at trough at steady-state 120 mg Q16W Estimated acute lowering ~35%

% CSF HTT KD† % HTT KD in cortex % HTT KD in caudate 20–30 30–55 5–20 30–40 40–70 15–35 40–50 55–80 25–45

Phase I/IIa and OLE data used to develop PK/PD model (120 mg IT Q8W)* Month mHTT change from baseline (%) –40 –20 –80 –60 6 12 18 21 24 3 15 9

Empirical trough pre-dose CSF data

slide-26
SLIDE 26

Q8W Q16W

PLACEBO

Changes to the dosing regimens have made participation in the Phase III study less demanding

Q4W, every month; Q8W, every 2 months; Q16W, every 4 months. Clinicaltrials.gov/show/NCT03761849 (Accessed February 2020).

26 MONTH

1 2 3 4 5 6 7 8 9 10 11 12 13 14 15 16 17 18 19 20 21 22 23 24 25

Q4W Q8W

PLACEBO

O R I G I N A L U P D AT E D

= Placebo injection = Tominersen 120 mg = Lumbar puncture only

slide-27
SLIDE 27

EFFECT ON EXPLORATORY CSF FLUID BIOMARKERS: NfL AND TAU

Tominersen OLE of the Phase I/IIa study

27

slide-28
SLIDE 28

The plausible role of NfL in HD and other CNS diseases

AD, Alzheimer’s disease; ALS, amyotrophic lateral sclerosis; CJD, Creutzfeldt–Jakob disease; CNS, central nervous system; FTD, frontotemporal dementia; HD, Huntington’s disease; HIV, human immunodeficiency virus; MS, multiple sclerosis; NfL, neurofilament light protein; SMA, spinal muscular atrophy; TBI, traumatic brain injury.

  • 1. Khalil M, et al. Nat Rev Neurol. 2018; 14:557–589; 2. Moseby-Knappe M, et al. JAMA Neurol. 2019; 76:64–71; 3. Gisslén M, et al. EBioMedicine. 2016; 3:135–140;
  • 4. Olsson B, et al. J Neurol. 2019; 266:2129–2136; 5. Byrne LM, et al. Lancet Neurol. 2017; 16:601–609.

28

  • NfL increases are associated with disease status and

severity, and have prognostic value across a range of diseases – HD, AD, ALS, FTD, MS, CJD, stroke, TBI,1 cardiac arrest,2 HIV-associated dementia3

  • NfL lowering with disease-modifying therapies in

MS,1 SMA,4 HIV-associated dementia3 and ALS is associated with clinical benefits

Association of elevated plasma NfL with HD stage5

  • In HD, observational findings require replication
  • No data yet on the expected response of NfL in a

treatment context

slide-29
SLIDE 29

CSF NfL increases in both arms at Day 141 and then decreases on continued treatment

Data points represent mean values and error bars represent 1 standard deviations. At the time of the data cut-off (18 July 2019) 43 out of the 46 patients had reached the 15-month visit timepoint (Q4W: n=22, Q8W: n=21), three patients were enrolled in the study 3 months after all

  • ther study participants and the 15-month visit had not been conducted at time of data cut-off.

BL, baseline; CSF, cerebrospinal fluid; NfL, neurofilament light protein; Q4W, every month; Q8W, every 2 months.

29

No associations between NfL increases and adverse events were observed

  • 50

50 100 150 200 250 300 350 400 BL 85 141 197 253 309 365 421 Q8W (N=23) 10% mean increase in NfL at 15 months

23 23 23 22 21 21 21 21

  • 50

50 100 150 200 250 300 350 400 BL 113 169 281 337 393 CSF NfL change from baseline (%) Q4W (N=23) 53% mean increase in NfL at 15 months

23 23 23 22 23 22 20 19 18 16 18 18 18 n=

Nominal time (day) Nominal time (day) CSF NfL change from baseline (%)

slide-30
SLIDE 30

CSF NfL levels in the Q8W arm decrease to within expected natural history range at 15 months

Data points represent mean values and error bars represent 1 standard deviations. At the time of the data cut-off (18 July 2019) 43 out of the 46 patients had reached the 15-month visit timepoint (Q4W: n=22, Q8W: n=21), three patients were enrolled in the study 3 months after all

  • ther study participants and the 15-month visit had not been conducted at time of data cut-off.

* HD-CSF trendline was interpolated from baseline and 24-month data points from early HD sample of HD-CSF. See poster number 91 for HD-CSF results. BL, baseline; CSF, cerebrospinal fluid; HD, Huntington’s disease; NfL, neurofilament light protein; Q4W, every month; Q8W, every 2 months.

30

NfL increases expected in untreated HD (estimated ~15% median increase at 15 months [HD-CSF]) Roche HD NHS data will provide comparator in matched sample with equal follow-up

  • 30
  • 10

10 30 50 70 90 110 130 150 BL 85 141 197 253 309 365 421 729 Visit day

CSF NfL change in the Q8W arm compared with untreated early HD patients in HD-CSF

23 23 23 22 21 21 21 21

CSF NfL change from baseline (%) Tominersen Q8W (N=23) Untreated patients (HD-CSF; N=28)*

n=

slide-31
SLIDE 31

CSF NfL and Tau are associated at baseline and over time during tominersen treatment

CSF, cerebrospinal fluid; NfL, neurofilament light protein; Q4W, every month; Q8W, every 2 months.

  • 1. Niemela V, et al. PLoS One. 2017; 12:e0172762.

31

CSF NfL and Tau are associated at baseline, consistent with literature to date1 Changes in CSF NfL and Tau are highly associated during transient peak at Day 141

120 mg tominersen Q4W 120 mg tominersen Q8W CSF Tau (log) CSF NfL (log) 8.4 8.0 7.6 7.2 6.8 5.0 5.5 6.0

Spearman correlation=0.44

2.0 1.5 1.0 0.5 –0.5 0.0 0.5 1.0 0.5 Change in CSF NfL (log) –0.5 Change in CSF Tau (log)

Spearman correlation=0.84

0.8 0.4 0.0 0.5 0.0

Spearman correlation=0.5

Change in CSF Tau (log) Change in CSF NfL (log)

Baseline Day 141 Day 253 Day 421

–0.25 0.5

Spearman correlation=0.38

Change in CSF Tau (log) 0.25 0.75 0.0 –0.5 0.0 0.5 1.0 1.5 Change in CSF NfL (log)

slide-32
SLIDE 32

CSF Tau levels in the Q8W arm decrease to within expected natural history range at 15 months

Data points represent mean values and error bars represent 1 standard deviations. At the time of the data cut-off (18 July 2019) 43 out of the 46 patients had reached the 15-month visit timepoint (Q4W: n=22, Q8W: n=21), three patients were enrolled in the study 3 months after all

  • ther study participants and the 15-month visit had not been conducted at time of data cut-off.

* HD-CSF trendline was interpolated from baseline and 24-month data points from early HD sample of HD-CSF. See poster number 91 for HD-CSF results. BL, baseline; CSF, cerebrospinal fluid; HD, Huntington’s disease; NfL, neurofilament light protein; Q4W, every month; Q8W, every 2 months.

32

Tau increases expected in untreated HD (estimated ~15% median increase at 15 months [HD-CSF]) Roche HD NHS data will provide comparator in matched sample with equal follow-up

  • 20
  • 10

10 20 30 40 50 60 70 BL 85 141 197 253 309 365 421 729 Visit day

CSF Tau change in the Q8W arm compared with untreated early HD patients in HD-CSF

CSF Tau change from baseline (%) Tominersen Q8W (N=23) Untreated patients (HD-CSF; N=28)*

23 23 23 22 21 21 21 20 n=

slide-33
SLIDE 33
  • Based on published literature, NfL appears relevant in HD and NfL and Tau levels are expected

to increase in untreated HD1,2

  • NfL levels increase then decrease on continued treatment, with Tau following the same trend
  • No associations were observed between NfL or Tau increases and adverse events

Exploratory fluid biomarker summary

HD, Huntington’s disease; NfL, neurofilament light protein.

  • 1. Byrne LM, et al. Lancet Neurol. 2017; 16:601–609; 2. Rodrigues FB, et al. J Neurochem. 2016; 139:22–25.

33

slide-34
SLIDE 34

Exploring potential mechanisms underlying the observed NfL changes

* See poster 110 for ongoing Roche/Genentech/Ionis/academy ongoing preclinical and mechanistic experiments and poster 28 on the role of NfL as a biomarker in HD. ASO, antisense oligonucleotide; CNS, central nervous system; CSF, cerebrospinal fluid; HD, Huntington’s disease; HTT, huntingtin protein; mHTT, mutant HTT; NfL, neurofilament light protein; SMI-35, mouse anti-phosphorylated neurofilament.

  • 1. Diprospero NA, et al. J Neurocytol. 2004; 33:517–533; 2. Nihei K, et al. Ann Neurol. 1992; 31:59–63; 3. Hodges A, et al. Hum Mol Gen. 2006;15:965−977.

34

  • Neurofilaments appear in aggregates in HD and may be

mis-localised in HD neurons1,2

  • Neurofilament is under negative transcriptional regulation by mHTT3

Control Pre-HD Late-stage HD Progressive loss of neurofilament staining in the human cortex immunostained with SMI-351

Potential underlying mechanisms* ASO exposure Non-sustained effects on vulnerable cell populations Reorganisation/remodelling of cells Changes in CSF flow dynamics Clearance and/or disposition of CNS proteins HTT lowering (mHTT and/or wild-type HTT) Non-sustained effects on vulnerable cell populations Reorganisation/remodelling of cells mHTT toxic species sparing in cells Aggregate clearing effect in cells

The mechanisms underlying observed treatment-induced NfL changes are under investigation

slide-35
SLIDE 35

Tominersen’s Clinical Development Programme for HD

* An additional 8 patients may be included to allow investigation of additional dose levels and repeat doses if necessary. CSF, cerebrospinal fluid; HD, Huntington's disease; OLE, open-label extension; PD, pharmacodynamics; PK, pharmacokinetics.

  • 1. Tabrizi SJ, et al. N Engl J Med. 2019; 380:2307–2316; 2. Clinicaltrials.gov/show/NCT03342053 (Accessed February 2020);
  • 3. Clinicaltrials.gov/show/NCT03664804 (Accessed February 2020); 4. Clinicaltrials.gov/show/NCT03761849 (Accessed February 2020);
  • 5. Clinicaltrials.gov/show/NCT03842969 (Accessed February 2020); 6. Clinicaltrials.gov/show/NCT04000594 (Accessed February 2020).

35

Longer-term follow-up will ultimately inform clinical outcomes of tominersen and the potential prognostic and predictive value of the candidate markers in the context of tominersen treatment of HD

slide-36
SLIDE 36
  • Preliminary data from the 15-month OLE study has been used to further inform the tominersen

Clinical Development Programme – The strength of the 120 mg tominersen effect on CSF mHTT allowed for amendment of GENERATION HD1 for testing less frequent regimens (Q8W and Q16W) – Additional collaborative mechanistic studies are ongoing to further understand the observed changes in exploratory fluid biomarkers in the OLE study

  • The programme will continue to generate data for tominersen, its effects on biomarkers and,

ultimately, on clinical outcomes – OLE vs Roche HD NHS comparison; Phase III GENERATION HD1 study

Overall summary of tominersen clinical development

CSF, cerebrospinal fluid; HD, Huntington’s disease; mHTT, mutant huntingtin protein; NHS, Natural History Study; OLE, open-label extension; Q8W, every 2 months; Q16W, every 4 months.

36

Many thanks to the HD community for the ongoing collaboration as we execute the studies of the Roche/Genentech/Ionis tominersen Clinical Development Programme

To access this presentation go to https://bit.ly/2tK3W0D