
SLIDE 1
Q3 2020: GROWTH AND INNOVATION OCTOBER 2020 Participants On Todays - - PowerPoint PPT Presentation
Q3 2020: GROWTH AND INNOVATION OCTOBER 2020 Participants On Todays Call Jerrold Annett Darren Pylot Mike Wickersham Raman Randhawa Brad Mercer VP, Strategy and President and CEO Mine GM, Pinto Valley SVP and CFO SVP, Exploration and
CAPSTONE MINING (TSX:CS) • 2
Darren Pylot
President and CEO
Raman Randhawa
SVP and CFO
Mike Wickersham
Mine GM, Pinto Valley
Brad Mercer
SVP, Exploration and Operations
Jerrold Annett
VP, Strategy and Capital Markets
CAUTIONARY NOTE ON FORWARD LOOKING INFORMATION
This document may contain “forward-looking information” within the meaning of Canadian securities legislation and “forward-looking statements” within the meaning of the United States Private Securities Litigation Reform Act of 1995 (collectively, “forward-looking statements”). These forward-looking statements are made as of the date of this document and the Company does not intend, and does not assume any obligation, to update these forward-looking statements, except as required under applicable securities legislation. Forward-looking statements relate to future events or future performance and reflect our expectations
statements with respect to the estimation of Mineral Resources and Mineral Reserves, the realization of Mineral Reserve estimates, the timing and amount of estimated future production, costs of production and capital expenditures, the success of our mining operations, the continuing success of mineral exploration, Capstone’s ability to fund future exploration activities, environmental risks, unanticipated reclamation expenses and title disputes. The potential effects of the COVID-19 pandemic on our business and operations are unknown at this time, including Capstone’s ability to manage challenges and restrictions arising from COVID-19 in the communities in which Capstone operates and our ability to continue to safely operate and to safely return our business to normal operations. The impact of COVID-19 to Capstone is dependent on a number of factors outside of our control and knowledge, including the effectiveness of the measures taken by public health and governmental authorities to combat the spread of the disease, global economic uncertainties and outlook due to the disease, and the evolving restrictions relating to mining activities and to travel in certain jurisdictions in which we operate. In certain cases, forward-looking statements can be identified by the use of words such as “plans”, “expects”, “budget”, “scheduled”, “estimates”, “forecasts”, “intends”, “anticipates”, “believes” or variations of such words and phrases, or statements that certain actions, events or results “may”, “could”, “would”, “might” or “will be taken”, “occur” or “be achieved” or the negative of these terms or comparable terminology. In this document certain forward-looking statements are identified by words including “anticipated”, “guidance”, “plan” and “expected”. By their very nature, forward-looking statements involve known and unknown risks, uncertainties and other factors that may cause our actual results, performance or achievements to be materially different from any future results, performance or achievements expressed or implied by the forward-looking statements. Such factors include, amongst others, risks related to inherent hazards associated with mining operations and closure of mining projects, future prices of copper and other metals, compliance with financial covenants, surety bonding, our ability to raise capital, Capstone’s ability to acquire properties for growth, counterparty risks associated with sales of our metals, use of financial derivative instruments and associated counterparty risks, foreign currency exchange rate fluctuations, market access restrictions or tariffs, changes in general economic conditions, accuracy of Mineral Resource and Mineral Reserve estimates, operating in foreign jurisdictions with risk of changes to governmental regulation, compliance with governmental regulations, compliance with environmental laws and regulations, reliance on approvals, licenses and permits from governmental authorities, acting as Indemnitor for Minto Exploration Ltd.’s surety bond obligations post divestiture, impact of climatic conditions on our Pinto Valley and Cozamin operations, aboriginal title claims and rights to consultation and accommodation, land reclamation and mine closure obligations, risks relating to widespread epidemics or pandemic outbreak including the COVID-19 pandemic; the impact of COVID-19 on our workforce, suppliers and other essential resources and what effect those impacts, if they occur, would have on our business, including our ability to access goods and supplies, the ability to transport our products and impacts on employee productivity, the risks in connection with the operations, cash flow and results of Capstone relating to the unknown duration and impact of the COVID-19 pandemic, uncertainties and risks related to the potential development of the Santo Domingo Project, increased operating and capital costs, challenges to title to our mineral properties, maintaining ongoing social license to operate, dependence on key management personnel, potential conflicts of interest involving our directors and officers, corruption and bribery, limitations inherent in our insurance coverage, labour relations, increasing energy prices, competition in the mining industry, risks associated with joint venture partners, our ability to integrate new acquisitions into our operations, cybersecurity threats, legal proceedings, and other risks of the mining industry as well as those factors detailed from time to time in the Company’s interim and annual financial statements and MD&A of those statements, all
important factors that could cause our actual results, performance or achievements to differ materially from those described in our forward-looking statements, there may be other factors that cause our results, performance or achievements not to be as anticipated, estimated or intended. There can be no assurance that
such statements. Accordingly, readers should not place undue reliance on our forward-looking statements.
ALTERNATIVE PERFORMANCE MEASURES
“C1 cash cost”, “cash cost”, “adjusted EBITDA”, “operating cash flow before changes in working capital”, “adjusted net income”, “net debt”, “all-in sustaining costs”, “all-in costs” and “available liquidity” are Alternative Performance Measures. Alternative performance measures are furnished to provide additional
management uses to monitor performance, to assess how the Company is performing, to plan and to assess the overall effectiveness and efficiency of mining
data presented by other mining companies. These performance measures should not be considered in isolation as a substitute for measures of performance in accordance with IFRS. For full information, please refer to the Company’s latest Management Discussion and Analysis published on its Financial Reporting webpage or on SEDAR.
CURRENCY
All amounts are in US$ unless otherwise specified.
COMPLIANCE WITH NI 43-101
Unless otherwise indicated, Capstone has prepared the technical information in this presentation (“Technical Information”) based on information contained in the technical reports and news releases (collectively the “Disclosure Documents”) available under Capstone Mining Corp.’s company profile on SEDAR at www.sedar.com. Each Disclosure Document was prepared by or under the supervision of a qualified person (a “Qualified Person” or “QP”) as defined in National Instrument 43-101 – Standards
information in this presentation, they should read the Technical Reports (available on www.sedar.com) in their entirety, including all qualifications, assumptions and exclusions that relate to the information set out in this presentation which qualifies the Technical Information. Readers are advised that mineral resources that are not mineral reserves do not have demonstrated economic viability. The Disclosure Documents are each intended to be read as a whole, and sections should not be read or relied upon out of context. The Technical Information is subject to the assumptions and qualifications contained in the Disclosure Documents. For further details refer to the Company’s NI 43-101 Technical Reports as follows:
effective Jan 1, 2016; and
The Technical Information in this presentation has been prepared in accordance with NI 43-101 and reviewed and approved by Brad Mercer, P. Geol., Capstone's Senior Vice President, Operations and Exploration, a Qualified Person as defined in NI 43- 101.
ADDITIONAL REFERENCE MATERIALS
Refer to the Company’s news release of October 28, 2020 and MD&A and Financial Statements for the three and nine months ended September 30, 2020, for full details to the information referenced throughout this presentation.
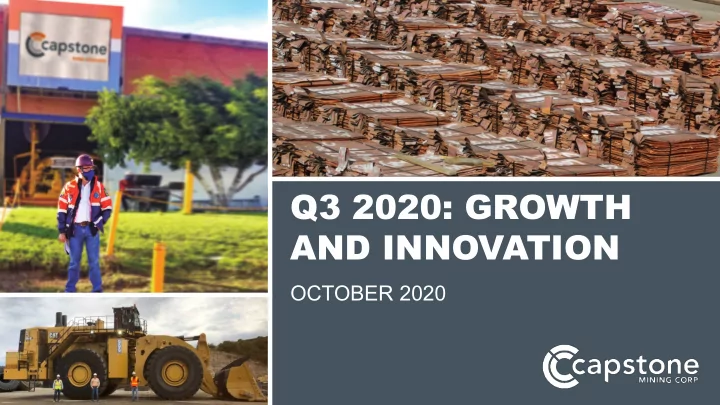
ON THE COVER PAGE (L to R)
1. Abel Gonzalez Vargas, General Manager, Cozamin Mine. 2. Copper cathode at Pinto Valley ready for shipment. Cathode expansion using new catalytic technology to recover copper from waste rock; expecting 300-350 Mlbs cathode production over next 20 years. 3. Pinto Valley recently revamped their loading fleet by purchasing a CAT 994K loader to use in place of one of their Hitachi 5600 shovels. The loader was put into use in July 2020 and will displace about 2,800 shovel hours in H2 2020. The loader will be cheaper for component replacements and maintenance work in years to come, and is only about 60% of the purchase price of the shovel. While productivity was expected to drop off, the loader has seen comparable truck loading times to the shovel. The loader has shown to be sized appropriately for the mine’s bench heights and mining widths. The loader burns 41 less gallons of fuel per hour than the shovel, both saving on operational costs and reduce CO2
second loader in 2021, as two loaders are expected to displace approximately 10,000 shovel hours a year, which should save approximately 410,000 gallons of fuel and millions in maintenance costs.
CAPSTONE MINING (TSX:CS) • 3
million pounds of copper production
C1 cash costs1
CAPSTONE MINING (TSX:CS) • 4
Q3 2020 YTD 2020 Copper production (million pounds) Pinto Valley 27.9 84.9 Cozamin 10.6 27.6
Total 38.5 112.5
C1 cash costs1 ($/lb.) produced Pinto Valley $2.38 $2.30 Cozamin $0.36 $0.71
Consolidated $1.82 $1.91
1.00 1.50 2.00 2.50 3.00 Jan-14 Apr-14 Jul-14 Oct-14 Jan-15 Apr-15 Jul-15 Oct-15 Jan-16 Apr-16 Jul-16 Oct-16 Jan-17 Apr-17 Jul-17 Oct-17 Jan-18 Apr-18 Jul-18 Oct-18 Jan-19 Apr-19 Jul-19 Oct-19 Jan-20 Apr-20 Jul-20 Oct-20 Rolling 12 month TRIFR Rolling 12 month LTIFR Industry TRIFR Industry LTIFR
Consolidated Safety Performance
Frequency (/200k hours)
KEY INITIATIVES
2017 improving case management
and "Leadership in Action"
unsafe acts and conditions
systems at PV and personal underground location tracking system at Cozamin
Industry TRIFR: National Mining Assn (USA) “Mine Safety & Health at a Glance 1931-2019” Industry LTIFR: MSHA (USA) “Mine Injury & Worktime Quarterly Statistics – Metal/Nonmetal Data
CAPSTONE MINING (TSX:CS) • 5
Optimization towards expected 10% production growth and 10% lower costs by 2021
significantly increase cathode production at Pinto Valley
Proven and Probable Reserves by 97%
sharing and advancing strategic process negotiations
production at Santo Domingo
~40% copper and ~20% silver equivalent production growth and ~20% lower costs by 2023
Cozamin underground expansion completion in Dec 2020
Cozamin pillar extraction PFS results, will be included in updated technical report in January 2021
PV3 Optimization balance of Phase 1 and Phase 2, plus cathode expansion
PV3 Optimization (H1 2021) and PV4 Expansion (2022) studies looking to innovation
Blast fragmentation and new mine equipment
Expanded use of catalytic leaching technology (Jetti Resources)
Coarse particle flotation (Eriez HydroFloat)
Tailings management
Santo Domingo strategic process
Sign a strategic partner and complete financing H1 2021
Transition from early works to major construction H2 2021
Completed This Year On Target
CAPSTONE MINING (TSX:CS) • 6
FINANCIAL OVERVIEW
(US$ millions)
Q3 2020 YTD 2020
Revenue 130.5 305.6 Net income (loss) 2.3 (15.3) Adjusted net income (loss)1 9.5 (8.7) Adjusted EBITDA from continuing
51.6 75.7 Cash flow from operating activities 27.7 79.8 Operating cash flow before changes in working capital1 44.9 65.6
1. These are alternative performance measures; refer to the Company’s MD&A for the three and nine months ended Sept 30, 2020 for full details. 2. EBITDA is earnings before interest, taxes, depletion and amortization. 3. From continuing operations, used as the Minto mine was sold on June 3, 2019. * For the nine months ended September 30, 2020. **For the three months ended September 30, 2020.
CAPSTONE MINING (TSX:CS) • 7
$56.8 million
cash and short-term investments
$80 million
undrawn revolver
$51.6 million
Adjusted EBITDA1 Q3 2020
1.62x
net debt/ EBITDA
Available liquidity1 as of Sept 30/20
G&A per pound payable*
Interest paid in Q3 2020**
Interest per pound payable**
75 basis points reduction in interest pricing results in ~$2 million per year annualized savings on interest expense
Sensitivity Analysis ($ millions) 2021E 2022E 2023E EBITDA Cu $3.00/lb, Ag $22.00/oz $215 $300 $315 Cu $3.25/lb, Ag $22.00/oz $260 $350 $370 Cu $3.00/lb, Ag $24.50/oz $220 $307 $322 EBITDA Sensitivity Copper +/- $0.25/lb $45 $50 $55 Silver +/- $2.50/oz $5 $7 $7
CAPSTONE MINING (TSX:CS) • 8
Umut Erol, Metallurgy, Lab and Process Control Superintendent, Pinto Valley
MINE INNOVATION:
Blast fragmentation to target 30% fines (minus ½”). Tele-remote dozer to increase worker safety for high risk
New mine equipment to increase efficiency while lowering
diesel consumption and GHG emissions. Capital of $6M with ~$800k/year in diesel and operating cost savings. METALLURGICAL INNOVATION:
Pioneering novel catalytic leaching technology from Jetti
Resources, expected to deliver 300-350 Mlbs copper
stockpiles at AISC under $2.00 per pound. Capital <$25M between 2022 to 2025.
□ Pilot plant testing of new coarse particle flotation
technology by Eriez HydroFloat to potentially increase
□ Molybdenum plant re-start with new reagents to improve
worker safety and improve overall metallurgical
completion by Q1 2021.
CAPSTONE MINING (TSX:CS) • 10
PHASE 1: $17 million in crushing and mill equipment replacements which is 60% completed, with full completion expected by July 2021. PHASE 2: $10 million in conveyor, mill auto controls, cyclone packs and tailings thickener upgrades planned to be completed by Q3 2021. TAILINGS MANAGEMENT: Third party study to review path for increased tailings safety and capacity. Completion by H1 2021.
CAPSTONE MINING (TSX:CS) • 11
9
1. Blast fragmentation optimization, new mine equipment 2. Tele-remote dozer 3. Fine Crushing Plant: larger secondary screen decks, two larger secondary crushers, crushing conveyor upgrades 4. Mill auto controls, four new ball mill shells, new hydrocyclones, *UNDER REVIEW* new mill motors to increase power efficiency and capacity 5. Rougher concentrate pumping capacity upgrade 6. Molybdenum plant re-start 7. *UNDER REVIEW* Pilot plant testing of new coarse particle flotation technology in November 2020 8. Tailings thickener circuit upgrades 9. *UNDER REVIEW* third party study to review Tailings Storage Facility for increased safety and capacity
Resources to enhance leach performance
A focus on return on incremental invested capital, while improving environmental and safety performance
1 2 3 4 5 6 7 8 10
10 20 30 40 50 60 1000x600 600x425 425x300 300x212 212x150 150x106 Total % Copper Losses Particle Size,(µm) Before After Overall Reduction in Cu Losses
Opportunity to Increase Overall Copper Recovery by 6%
Eriez Flotation, a world leader in innovative flotation technology has developed a fluidized bed assisted flotation cell call HydroFloat. Positive laboratory results on Pinto Valley flotation circuit samples, Eriez reported an
up to 6%. Pilot plant testing will commence in November 2020 with results expected in Q1 2021. Potential benefits include higher mill throughput while achieving higher copper recovery, lower grinding costs, lower water and energy consumption and increased tailings stability via courser tailings.
Copper Losses Distribution Before and After HydroFloat Laboratory Results by Eriez Flotation
CAPSTONE MINING (TSX:CS) • 12
CAPSTONE MINING (TSX:CS) • 13
2020
Innovation
Ramp up of copper cathode production by pioneering a novel catalytic technology from Jetti Resources, targeting leaching of copper in high grade waste and historic stockpiles Pilot plant testing coarse particle flotation technology in Nov 2020 Blast fragmentation New mine equipment
2022-2023
PV4 Expansion Study
PV4 Expansion evaluating scenarios for increased mining rates, higher mill grades and increased
release in 2022.
A long-life, multi-generational mine currently focused on innovation and optimization to surface value for our stakeholders
Mineral Resource Estimate as at December 31, 2019
(metric units) Mineral Resources at 0.17% Cu Cutoff (Inclusive of Mineral Reserves) Category Tonnes (million) Cu (%) Mo (%) Measured (M) 567 0.33 0.006 Indicated (I) 791 0.28 0.005 Total M + I 1,357 0.30 0.005 Inferred 176 0.25 0.005
Annual Information Form for full details.
2021
PV3 Optimization Study
Expected 10% production growth and 10% lower
by 2022/23. Study scheduled for release in H1 2021.
NI 43-101 Technical Report Update
in H2 2021
2039+
~20 years mine life with extension and production expansion potential
Current mine life to 2039; total Reserve Estimate1 of 399 million tonnes grading at 0.31% copper.
*Commercial production achieved in September 2006 **Year to date to September 30, 2020
1C1 cash costs is an Alternative Performance Measure.
CAPSTONE MINING (TSX:CS) • 15
$- $0.50 $1.00 $1.50 $2.00 $2.50
4,000 6,000 8,000 10,000 12,000 14,000
C1 cash costs net of by-products Mlbs Copper Production
Mlbs C1 Cost
2007 2008 2009 2010 2011 2012 2013 2014 2015 2016 2017 2018 2019 2020** Quarterly average copper production (Mlbs)* 5,039 6,593 9,206 8,888 10,303 11,727 11,379 11,416 8,626 7,885 9,222 9,039 8,961 9,214 C1 cash costs1 net of by-products ($/lb) $0.74 $1.44 $0.90 $1.25 $1.27 $1.09 $1.18 $1.26 $1.47 $1.48 $1.16 $0.75 $0.70 $0.71
Q3 2020 C1 cash costs1 $0.36 per pound
One-Way Haulage Loop
Only 31 vertical meters until completion in early December 2020. Ramp up to 1.35 tonnes milled per annum by Q2 2021 on time and budget.
Paste Backfill and Dry Stack Tailings
PFS of an underground paste backfill system targeting the extraction of up to 3.5 million tonnes of Indicated Mineral Resources grading 1.89% copper and 42 g/t silver remaining in the MNFWZ in unmined pillars. Updated NI 43-101 expected in January 2021.
Stope Dilution
Reduction with improved engineering, planning, long-hole drill control and optimized explosives design.
Truckless Headings
Redesign upper areas of Cozamin Reserves to use ore pass, increasing safety and efficiency, while increasing air quality, thereby decreasing ventilation requirements in these areas.
Further Resource to Reserve Conversion
Exclusive of the pillars and reserves, the Indicated Mineral Resource in the MNFWZ are as follows:
Work will be initiated to evaluate alternative mining techniques capable of lower costs and decreased dilution.
Exploration Upside
80-Hole Drill Program Ongoing Targeting expansion potential of both Vein 10 and Vein 20 to the southeast, both within and external to the last Mineral Resource estimate Executed an earn-in deal with Alien Metals Ltd. for exploration drilling 50 km away from Cozamin’s mill, on the Pan American Highway; their Donovan 2 copper-gold project is an undrilled bedrock volcanogenic massive sulphide (VMS)-style discovery
CAPSTONE MINING (TSX:CS) • 16
Sept 16, 2020: Capstone Enters into MOU with Puerto Ventanas S.A. for Rail and Port Facilities at Santo Domingo
(TSX:CS) • 18
~1,000m above sea level 20 km
REGION III, CHILE
Significant De-Risking Capital Spend for Santo Domingo
1. Fixed capital costs, turn-key proposal from Posco E&C for mine site infrastructure at below Feasibility estimates 2. MOU with Puerto Ventanas S.A. to potentially transfer $400 million in capital expenditure for off-site infrastructure 3. Reduced capital spend is $1.1 billion (100% basis)
Pathway on Financing the Reduced Capital Estimate
1. Gold Stream Financing Payable gold over 18 year mine life is 283k ounces (100% basis); gold stream worth ~$300 million 2. Project Debt Financing Debt structure assigned to project level for 50% of reduced project capital estimate 3. Cash Proceeds on Sale of Capstone Interest For a strong partner with a track record of mine building, ramp-up and
CAPSTONE MINING (TSX:CS) • 19
Illustrative Pathway to Financing Santo Domingo
Santo Domingo Financial Plan $ Millions Reduced capital scenario ~$1,100M Gold stream financing (~$300M) Capital spend net of gold stream financing $800M Project financing – 50% of project capital ($550M) Remaining balance of capital to be funded @ 100% $250M Capstone portion based on current ownership 70% $175M Potential Capstone cash proceeds on sale of portion of interest ?? Capstone remaining balance required equity contribution Target is Zero
2020e 2021e 2022e 2023e
C1 Cash Costs per lb
*Assumes gold to silver ratio of 78x, $1,950/oz Au, $25/oz Ag. Silver and gold ounces are combined Pinto Valley + Cozamin. Copper pricing for EBITDA: Q4 2020 $3.00/lb (results in $2.84/lb for full year 2020 avg.). 2021/2022/2023 - $3.00/lb. C1 cash costs are Alternative Performance Measures; refer to the Company’s MD&A for the three and nine months ended September 30, 2020 for full details.
CAPSTONE MINING (TSX:CS) • 20
2020e 2021e 2022e 2023e
Copper
$115 Million $210 Million $285 Million $310 Million
2020e $2.84/lb Cu 2021e $3.00/lb Cu 2022e $3.00/lb Cu 2023e $3.00/lb Cu 2020e 2021e 2022e 2023e
Silver Equivalent Gold Ounces* Silver
~40% copper production growth >20% silver equivalent production growth ~20% lower C1 cash costs
170% EBITDA GROWTH AT $3.00 COPPER
~2.7 Moz ~140-155 Mlbs ~180 Mlbs ~$1.85 to $2.00 ~1.8 Moz ~2.6 Moz ~2.0 Moz ~200 Mlbs ~210 Mlbs ~$1.75 ~$1.50 ~$1.45
148 Mlbs 180 Mlbs 200 Mlbs 210 Mlbs 375 Mlbs
2020E 2021E 2022E 2023E 2024E SANTO DOMINGO
CAPSTONE MINING (TSX:CS) • 21
CAPSTONE MINING (TSX:CS) • 22
COPPER Total Proven & Probable Cu Mineral Reserve 1.24 Mt contained metal (399 Mt @ 0.31% Cu) Total Measured & Indicated Cu Mineral Resource 4.13 Mt contained metal (1,357 Mt @ 0.30% Cu) Measured Cu Mineral Resource 1.89 Mt contained metal (567 Mt @ 0.33% Cu) Indicated Cu Mineral Resource 2.24 Mt contained metal (791 Mt @ 0.28% Cu) Inferred Cu Mineral Resource 0.43 Mt contained metal (176 Mt @ 0.25% Cu) MOLYBDENUM Total Proven & Probable Mo Mineral Reserve 0.025 Mt contained metal (399 Mt @ 0.006% Mo) Total Measured & Indicated Mo Mineral Resource 0.074 Mt contained metal (1,357 Mt @ 0.005% Mo) Inferred Mo Mineral Resource 0.043 Mt contained metal (176 Mt @ 0.005% Mo)
NOTES All Mineral Reserves and Mineral Resources as at December 31, 2019. For full information, please refer to the Company’s Annual Information Form for December 31, 2019 available on www.capstonemining.com or SEDAR. Reserves: Claydon Craig, P.Eng., Superintendent of Mine Technical Services at Pinto Valley is the Qualified Person responsible for the Pinto Valley Mineral Reserves estimate. Economic inputs to the block model were USD$2.75/lb Cu and USD$12.50/lb Mo. Mineral Reserves are reported above 0.175% Cu cut-off grade. Summation errors due to rounding. Contained metals are reported at 100%. Resources: Klaus Triebel, CPG., Chief Geologist at Pinto Valley, is the Qualified Person responsible for the Pinto Valley Mineral Resources
inclusive of Mineral Reserves. Mineral Resources are reported as at December 31, 2019 above a 0.17% Cu cut-off grade. The economic assumptions for the reasonable prospects pit include: $3.30/lb Cu, $10.00/lb Mo, 88% Cu recovery, 50% Mo recovery, $1.50/ton mining costs, $1.50/ton G&A costs, $5.00/ton milling costs, and a pit slope of 45°. Totals may not tally due to rounding. Contained metals are reported at 100%.
CAPSTONE MINING (TSX:CS) • 23
COPPER Total Proven & Probable Cu Mineral Reserve 182 kt contained metal (10,178 kt @ 1.79% Cu) Total Measured & Indicated Cu Mineral Resource 430 kt contained metal (27,459 kt @ 1.57% Cu) Inferred Cu Mineral Resource 106 kt contained metal (16,558 kt @ 0.64% Cu) SILVER Total Proven & Probable Ag Mineral Reserve 13,527 koz contained metal (10,178 kt @ 41 g/t Ag) Total Measured & Indicated Ag Mineral Resource 39,209 koz contained metal (27,459 kt @ 44 g/t Ag) Inferred Ag Mineral Resource 18,983 koz contained metal (16,558 kt @ 36 g/t Ag) ZINC Total Proven & Probable Zn Mineral Reserve 36 kt contained metal (10,178 kt @ 0.36% Zn) Total Measured & Indicated Zn Mineral Resource 314 kt contained metal (27,459 kt @ 1.14% Zn) Inferred Zn Mineral Resource 375 kt contained metal (16,558 kt @ 2.26% Zn) LEAD Total Proven & Probable Pb Mineral Reserve 5 kt contained metal (10,178 kt @ 0.05% Pb) Total Measured & Indicated Pb Mineral Resource 87 kt contained metal (27,459 kt @ 0.32% Pb) Inferred Pb Mineral Resource 101 kt contained metal (16,558 kt @ 0.61% Pb)
NOTES: Mineral Resources and Mineral Reserves as at April 30, 2020. For full information, please refer to the Company’s news release of September 9, 2020. RESERVES: Tucker Jensen, P.Eng., Superintendent Mine Operations at Capstone Mining Corp., is the Qualified Person for the Cozamin Mineral Reserve. Disclosure of the Cozamin Mine Mineral Reserve as of April 30, 2020 was completed using fully diluted mineable stope shapes generated by the Maptek Vulcan Mine Stope Optimizer software and estimated using the 2020 MNFW and MNV resource block models by Garth Kirkham, P.Geo., FGC, Kirkham Geosystems Ltd. Mineral Reserves are reported at a US$52.29/t net smelter return (“NSR”) cut-off using the NSR20CuRSV formula: ($50.762*%Cu + $0.412*Ag ppm)*(1-NSRRoyalty%) for copper zones based on metal price assumptions (in US$) of Cu = $2.75/lb and Ag = $17.00/oz, and metal recoveries of 96% Cu, 86% Ag and the NSR20ZnRSV formula: ($49.756*%Cu + $0.381*Ag ppm + $8.035*%Pb + $11.820*%Zn)*(1-NSRRoyalty%) for zinc zones based on metal price assumptions (in US$) of Cu = $2.75/lb, Ag = $17.00/oz, Pb = $0.90/lb, Zn = $1.00/lb and metal recoveries of 94% Cu, 78% Ag, 47% Pb and 67% Zn. Tonnage and grade estimates include dilution and recovery allowances. The NSR royalty rate applied varies between 1% and 3% depending on the mining concession. An exchange rate of MX$20 per US$1 is assumed. All metals are reported as contained. Figures may not sum exactly due to rounding.. RESOURCES: Garth Kirkham, P.Geo., FGC, Kirkham Geosystems Ltd. is the independent Qualified Person for the Cozamin Mineral Resource. Mineral Resources are classified according to CIM (2014) definitions, estimated following CIM (2019) guidelines and have an effective date of April 30, 2020. Mineral Resources are reported using NSR20RES formula: (Cu*$60.535 + Ag*$0.472 + Zn*14.865 + Pb*$9.147)*(1-Royalty%) based on metal price assumptions (in US$) of Cu = $3.25/lb, Ag = $20.00/oz, Zn = $1.20/lb, Pb = $1.00/lb, metal recoveries of 95% Cu, 82% Ag, 70% Zn, 48% Pb, confidential current smelter contract terms, transportation costs and royalty agreements from 1 to 3%, as applicable, are incorporated. An exchange rate of MX$20 per US$1 is assumed. Totals may not sum exactly due to rounding. The NSR cut-off of US$50/tonne is based on historical mining and milling costs plus general and administrative costs. The Mineral Resources considers underground mining by long-hole stoping and mineral processing by flotation. No dilution is incorporated in the Mineral Resource. All metals are reported as contained. Mineral Resource estimates do not account for mineability, selectivity, mining loss and dilution. These Mineral Resource estimates include Inferred Mineral Resources considered too speculative geologically to apply economic considerations for categorization as Mineral Reserves. However, it is reasonably expected that the majority of Inferred Mineral Resources could be upgraded to Indicated Resources.
CAPSTONE MINING (TSX:CS) • 24
COPPER EQUIVALENT Total Measured & Indicated CuEq Mineral Resource 537 Mt @ 0.52% CuEq Inferred CuEq Mineral Resource 48 Mt @ 0.41% CuEq COPPER Total Proven & Probable Cu Mineral Reserve 1,167 kt contained metal (392.3 Mt @ 0.30% Cu) Total Measured & Indicated Cu Mineral Resource 537 Mt @ 0.30% Cu Inferred Cu Mineral Resource 48 Mt @ 0.19% Cu GOLD Total Proven & Probable Au Mineral Reserve 506.7 koz contained metal (392.3 Mt @ 0.04 g/t Au) Total Measured & Indicated Au Mineral Resource 537 Mt @ 0.039 g/t Au Inferred Au Mineral Resource 48 Mt @ 0.025 g/t Au IRON Total Proven & Probable Fe Mineral Reserve 75.1 Mt magnetite concentrate (392.3 Mt @ 28.2% Fe) Total Measured & Indicated Fe Mineral Resource 537 Mt @ 25.7% Fe Inferred Fe Mineral Resource 48 Mt @ 23.6% Fe
NOTES: Mineral Reserves as at December 31, 2019 and Mineral Resources as at February 13, 2020. For full information, please refer to the Company’s Annual Information Form for December 31, 2019 available on www.capstonemining.com or SEDAR. RESERVES: Mineral Reserves have an effective date of 14 November 2018 and were prepared by Mr. Carlos Guzman, CMC, an employee of NCL. Mineral Reserves are reported as constrained within Measured and Indicated pit designs and supported by a mine plan featuring variable throughput rates and cut-off
US$1,280/oz Au and US$100/dmt of Fe concentrate; average recovery to concentrate is 93.4% for Cu and 60.1% for Au, with magnetite concentrate recovery varying on a block-by-block basis; copper concentrate treatment charges of US$80/dmt, U$0.08/lb of copper refining charges, US$5.0/oz of gold refining charges, US$33/wmt and US$20/dmt for shipping copper and iron concentrates respectively; waste mining cost of $1.75/t, mining cost of US$1.75/t ore and process and G&A costs of US$7.53/t processed; average pit slope angles that range from 37.6º to 43.6º; a 2% royalty rate assumption and an assumption of 100% mining recovery. Rounding as required by reporting standards may result in apparent summation differences between tonnes, grade and contained metal
reported as troy ounces, contained copper as million pounds and contained iron as metric million tonnes.
RESOURCES: Mineral Resources are classified according to CIM (2014) standards. Mineral Resources are reported inclusive of Mineral Reserves. Mineral Resources that are not Mineral Reserves do not have demonstrated economic viability. The Qualified Person for the estimates is
the Santo Domingo Sur, Iris, Iris Norte and Estrellita deposits have an effective date of 13 February 2020. Mineral Resources for the Santo Domingo Sur, Iris, Iris Norte and Estrellita deposits are reported using a cut-off grade of 0.125% copper equivalent (CuEq). CuEq grades are calculated using average long-term prices of US$3.50/lb) Cu, US$1,300/oz Au and US$99/(dmt) Fe conc. The CuEq equation is: % Cu Equivalent = (Cu Metal Value + Au Metal Value + Fe Metal Value) / (Cu Metal Value per percent Cu). The general equation for metal value is: Metal Value = Grade * Cm * R * (Price – TCRC – Freight) * (100 – Royalty) / 100, were Cm is a constant to convert the grade of metal to metal price units, R is metallurgical recovery, and TCRC is smelter treatment charges and penalties. Only copper, gold and iron were recognized in the CuEq calculation; cobalt and sulphur were excluded. Mineral Resources are constrained by preliminary pit shells derived using a Lerchs–Grossmann algorithm and the following assumptions: pit slopes averaging 45º; mining cost of US$1.90/t, processing cost of US$7.27/t (including G&A cost); processing recovery of 89% copper and 79% gold, iron recoveries are calculated based on magnetic susceptibility; and metal prices of US$3.50/lb Cu, US$1,300/oz Au and US$99/dmt Fe concentrate. Rounding as required by reporting standards may result in apparent summation differences. Tonnage measurements are in metric units. Copper, iron and sulphur are reported as percentages, gold as grams per tonne and cobalt as parts per million.
GENERAL INQUIRIES Capstone Mining Corp. Suite 2100 – 510 West Georgia Street Vancouver, BC V6B 0M3
www.capstonemining.com info@capstonemining.com 1-604-684-8894 1-866-684-8894 (N.A. toll free) MEDIA AND INVESTOR INQUIRIES
Jerrold Annett Vice President, Strategy & Capital Markets Suite 2700 – 161 Bay Street Toronto, ON M5J 2S1
1-416-572-2272
Virginia Morgan Manager, Investor Relations & Communications Suite 2100 – 510 West Georgia Street Vancouver, BC V6B 0M3
604-674-2268 info@capstonemining.com