Readings Covered Further Readings Ware Interaction: Data - - PowerPoint PPT Presentation

readings covered further readings ware interaction data
SMART_READER_LITE
LIVE PREVIEW

Readings Covered Further Readings Ware Interaction: Data - - PowerPoint PPT Presentation

Readings Covered Further Readings Ware Interaction: Data Manipulation Ware, Chap 10: Interacting with Visualizations. first half, p 317-324 Toolglass and magic lenses: the see-through interface. Eric A. Bier, low-level control loops Maureen C.


slide-1
SLIDE 1

Lecture 7: Multiples/Interaction

Information Visualization CPSC 533C, Fall 2009 Tamara Munzner UBC Computer Science Wed, 30 September 2009 1 / 36

Readings Covered

Ware, Chap 10: Interacting with Visualizations. first half, p 317-324 Tufte, Chap 4: Small Multiples Building Highly-Coordinated Visualizations In Improvise. Chris Weaver.
  • Proc. InfoVis 2004
The Visual Design and Control of Trellis Display. R. A. Becker, W. S. Cleveland, and M. J. Shyu Journal of Computational and Statistical Graphics, 5:123-155. (1996). Exploring High-D Spaces with Multiform Matrices and Small Multiples. Alan MacEachren, Xiping Dai, Frank Hardisty, Diansheng Guo, and Gene
  • Lengerich. Proc InfoVis 2003.
2 / 36

Further Readings

Toolglass and magic lenses: the see-through interface. Eric A. Bier, Maureen C. Stone, Ken Pier, William Buxton, and Tony D. DeRose.
  • Proc. SIGGRAPH’93, pp. 73-76.
State of the Art: Coordinated & Multiple Views in Exploratory
  • Visualization. Jonathan C. Roberts. Proc. Conference on Coordinated &
Multiple Views in Exploratory Visualization (CMV) 2007. The cognitive coprocessor architecture for interactive user interfaces George Robertson, Stuart K. Card, and Jock D. Mackinlay, Proc. UIST ’89, pp 10-18. Excentric Labeling: Dynamic Neighborhood Labeling for Data
  • Visualization. Jean-Daniel Fekete and Catherine Plaisant. Proc. CHI’99,
pages 512-519. 3 / 36

Ware Interaction: Data Manipulation

low-level control loops choice reaction time depends on number of choices selection time: Fitts’ Law depends on distance, target size path tracing depends on width learning: power law of practice also subtask chunking 4 / 36

Ware Interaction

low-level control loops two-handed interaction: Guiard’s theory coarse vs. fine control e.g. paper vs. pen positioning 5 / 36

Two-Handed Interaction Example

toolglass: semi-transparent click-through tool magic lens: see-through tool [Toolglass and magic lenses: the see-through interface. Eric A. Bier, Maureen C. Stone, Ken Pier, William Buxton, and Tony D. DeRose.
  • Proc. SIGGRAPH’93, pp. 73-76.]
6 / 36

Ware Interaction

low-level control loops two-handed interaction: Guiard’s theory coarse vs. fine control e.g. paper vs. pen positioning vigilance difficult, erodes with fatigue control compatability learning/transfer: adaption time depends hover/mouseover/tooltip faster than explicit click 7 / 36

Small Multiples

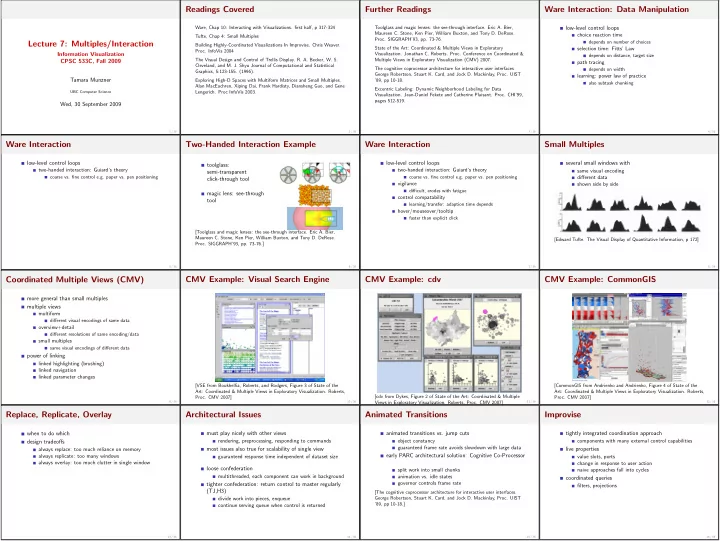
several small windows with same visual encoding different data shown side by side [Edward Tufte. The Visual Display of Quantitative Information, p 172] 8 / 36

Coordinated Multiple Views (CMV)

more general than small multiples multiple views multiform different visual encodings of same data
  • verview+detail
different resolutions of same encoding/data small multiples same visual encodings of different data power of linking linked highlighting (brushing) linked navigation linked parameter changes 9 / 36

CMV Example: Visual Search Engine

[VSE from Boukhelfia, Roberts, and Rodgers, Figure 3 of State of the Art: Coordinated & Multiple Views in Exploratory Visualization. Roberts,
  • Proc. CMV 2007]
10 / 36

CMV Example: cdv

[cdv from Dykes, Figure 2 of State of the Art: Coordinated & Multiple Views in Exploratory Visualization. Roberts, Proc. CMV 2007] 11 / 36

CMV Example: CommonGIS

[CommonGIS from Andrienko and Andrienko, Figure 4 of State of the Art: Coordinated & Multiple Views in Exploratory Visualization. Roberts,
  • Proc. CMV 2007]
12 / 36

Replace, Replicate, Overlay

when to do which design tradeoffs always replace: too much reliance on memory always replicate: too many windows always overlay: too much clutter in single window 13 / 36

Architectural Issues

must play nicely with other views rendering, preprocessing, responding to commands most issues also true for scalability of single view guaranteed response time independent of dataset size loose confederation multithreaded, each component can work in background tighter confederation: return control to master regularly (TJ,H3) divide work into pieces, enqueue continue serving queue when control is returned 14 / 36

Animated Transitions

animated transitions vs. jump cuts
  • bject constancy
guaranteed frame rate avoids slowdown with large data early PARC architectural solution: Cognitive Co-Processor split work into small chunks animation vs. idle states governor controls frame rate [The cognitive coprocessor architecture for interactive user interfaces. George Robertson, Stuart K. Card, and Jock D. Mackinlay, Proc. UIST ’89, pp 10-18.] 15 / 36

Improvise

tightly integrated coordination approach components with many external control capabilities live properties value slots, ports change in response to user action naive approaches fall into cycles coordinated queries filters, projections 16 / 36
slide-2
SLIDE 2

Coordinating Axes

scatterplot from components [ Building Highly-Coordinated Visualizations In Improvise. Chris Weaver.
  • Proc. InfoVis 2004]
17 / 36

Coordinating Multiple Scatterplots

sync horizontal but not vertical scrolling [ Building Highly-Coordinated Visualizations In Improvise. Chris Weaver.
  • Proc. InfoVis 2004]
18 / 36

Example: Complex Application

[ Building Highly-Coordinated Visualizations In Improvise. Chris Weaver.
  • Proc. InfoVis 2004]
19 / 36

Selection

selection decoupled from data selection-dependent loading, filtering, projection highlighting: user-customizeable differentiation of selected
  • vs. unselected items
video 20 / 36

Critique

21 / 36

Critique

sophisticated and powerful approach to coordination but very large learning curve to build new apps [ Building Highly-Coordinated Visualizations In Improvise. Chris Weaver.
  • Proc. InfoVis 2004]
22 / 36

Automatic Dotplot Ordering: Trellis

alphabetical site,variety use group median [The Visual Design and Control of Trellis Display. Becker, Cleveland, and Shyu. JCSG 5:123-155 1996] 23 / 36

Trellis Structure

conditioning/trellising: choose structure pick how to subdivide into panels pick x/y axes for indiv panels explore space with different choices multiple conditioning
  • rdering
large-scale: between panels small-scale: within panels main-effects: sort by group median derived space, from categorical to ordered 24 / 36

Confirming Hypothesis

dataset error with Morris switched?
  • ld trellis: yield against variety given
year/site new trellis: yield against site and year given variety exploration suggested by previous main-effects ordering [The Visual Design and Control of Trellis Display. Becker, Cleveland, and Shyu. JCSG 5:123-155 1996] 25 / 36

Partial Residuals

fixed dataset, Morris data switched explicitly show differences take means into account line is 10% trimmed mean (toss
  • utliers)
[The Visual Design and Control of Trellis Display. Becker, Cleveland, and Shyu. JCSG 5:123-155 1996] 26 / 36

Critique

27 / 36

Critique

careful attention to statistics and perception finding signals in noisy data trends, outliers exploratory data analysis (EDA) Tukey work fundamental, Cleveland continues 28 / 36

Multiform Matrices and Small Multiples

matrices for bivariate exploration (SPLOM and other)
  • vs. small multiples for univariate
uniform vs. multiform multiples techniques juxtaposition sorting/ordering manipulation linking multiple bivariate views [ Exploring High-D Spaces with Multiform Matrices and Small Multiples. Alan MacEachren, Xiping Dai, Frank Hardisty, Diansheng Guo, and Gene
  • Lengerich. Proc InfoVis 2003. ]
29 / 36

Multiform Bivariate Small Multiple

common variable: per capita income per-column variables: type of cancer mortality per-row forms: scatterplot, choropleth/thematic map left bright green: high income, low cervical cancer hypoth: not screened right dark green: low income, high breast cancer hypoth: late childbearing [ Exploring High-D Spaces with Multiform Matrices and Small Multiples. MacEachren et al, Proc. InfoVis 2003. ] 30 / 36

Multiform Bivariate Matrix

scatterplots/maps, histograms along diagonal per-column vars: mortality, early detection, recent screening univariate map var: screening facility availability [ Exploring High-D Spaces with Multiform Matrices and Small Multiples. MacEachren et al, Proc. InfoVis 2003. ] 31 / 36

Spacefill Form

linked highlight of low doctor ratio counties from scatterplot spacefill shows it’s roughly half the items [ Exploring High-D Spaces with Multiform Matrices and Small Multiples. MacEachren et al, Proc. InfoVis 2003. ] 32 / 36
slide-3
SLIDE 3

Sorting and Linking

sorting manual: direct manipulation from user automatic: conditional entropy metric automatic: hierarchical clustering to find interesting linking highlighting many others background color, subspce, conditioning, ... conditioning: filter in/out of given range on another var video 33 / 36

Excentric Labels

show labels around mouseover region demo [Excentric Labeling: Dynamic Neighborhood Labeling for Data
  • Visualization. Jean-Daniel Fekete and Catherine Plaisant. Proc. CHI’99,
pages 512-519.] [http://www.cs.umd.edu/hcil/excentric/] 34 / 36

Critique

35 / 36

Critique

great previous work taxonomy great explanation of how vis techniques used with specific data can lead to hypothesis generation careful use of color 36 / 36