
Regression and Survival Analysis
Tyler Moore
Computer Science & Engineering Department, SMU, Dallas, TX
Lecture 15–16
Guide to exploring data
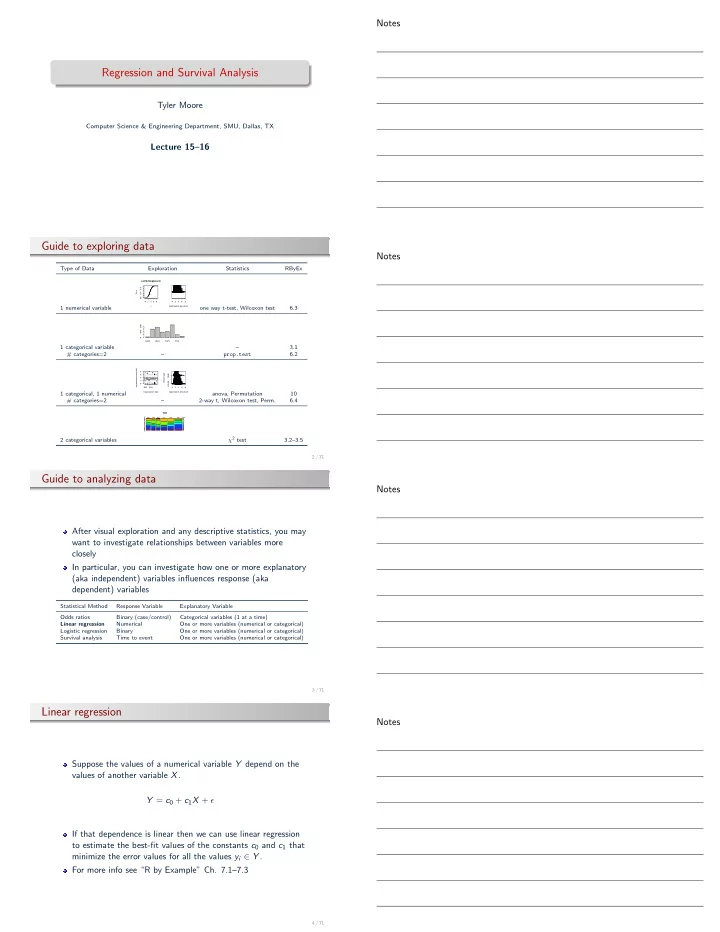
Type of Data Exploration Statistics RByEx 1 numerical variable
2 4 6 8 0.0 0.4 0.8 ecdf(br$logbreach) x Fn(x) 2 4 6 8 log(#records breached)- ne way t-test, Wilcoxon test
6.3 1 categorical variable
CARD HACK PHYS STAT 400 800– 3.1 # categories=2 – prop.test 6.2 1 categorical, 1 numerical
- BSF
- ●
- anova, Permutation
10 # categories=2 – 2-way t, Wilcoxon test, Perm. 6.4 2 categorical variables
TOH BSF BSO BSR EDU GOV MED NGO CARD DISC HACK INSD PHYS PORT STAT UNKNχ2 test 3.2–3.5
2 / 71
Guide to analyzing data
After visual exploration and any descriptive statistics, you may want to investigate relationships between variables more closely In particular, you can investigate how one or more explanatory (aka independent) variables influences response (aka dependent) variables
Statistical Method Response Variable Explanatory Variable Odds ratios Binary (case/control) Categorical variables (1 at a time) Linear regression Numerical One or more variables (numerical or categorical) Logistic regression Binary One or more variables (numerical or categorical) Survival analysis Time to event One or more variables (numerical or categorical)
3 / 71
Linear regression
Suppose the values of a numerical variable Y depend on the values of another variable X. Y = c0 + c1X + ǫ If that dependence is linear then we can use linear regression to estimate the best-fit values of the constants c0 and c1 that minimize the error values for all the values yi ∈ Y . For more info see “R by Example” Ch. 7.1–7.3
4 / 71
Notes Notes Notes Notes