
SLIDE 1
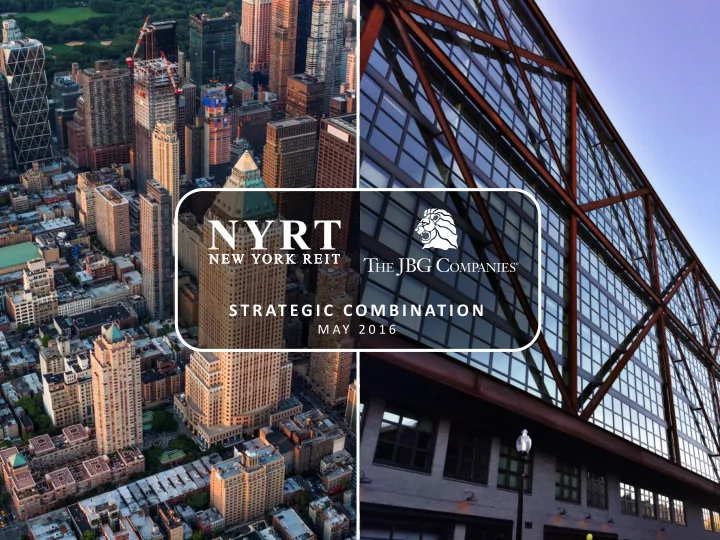
S T R AT E G I C C O M B I N AT I O N
M AY 2 0 1 6
S T R AT E G I C C O M B I N AT I O N M AY 2 0 1 6 D i s c l a i - - PowerPoint PPT Presentation
S T R AT E G I C C O M B I N AT I O N M AY 2 0 1 6 D i s c l a i m e r C a u t i o n a r y N o t e Re ga r d i n g F o r w a rd - L o o k i n g S t a t e m e n t s The statements in this document that are not historical facts may be
S T R AT E G I C C O M B I N AT I O N
M AY 2 0 1 6
G e n e ra l J B G D i s c l a i m e r C a u t i o n a r y N o t e Re ga r d i n g F o r w a rd - L o o k i n g S t a t e m e n t s
The statements in this document that are not historical facts may be forward-looking statements. These forward-looking statements involve substantial risks and uncertainties. Actual results or events could differ materially from the plans, intentions and expectations disclosed in the forward-looking statements New York REIT, Inc. (the “Company”) makes. Forward-looking statements may include, but are not limited to, statements regarding stockholder liquidity and investment value and returns. The words “anticipates,” “believes,” “expects,” “estimates,” “projects,” “plans,” “intends,” “may,” “will,” “would,” and similar expressions are intended to identify forward-looking statements, although not all forward-looking statements contain these identifying words. Factors that might cause such differences include, but are not limited to, the factors included in the Company’s reports filed with the Securities and Exchange Commission (the “SEC”), particularly in the “Risk Factors” and “Management's Discussion and Analysis of Financial Condition and Results of Operations” sections of the Company’s Annual Report on Form 10-K for the year ended December 31, 2015, filed with the SEC on February 26, 2016, the Company’s latest Quarterly Report on Form 10-Q for the quarter ended March 31, 2016, filed with the SEC on May 10, 2016 and in Exhibit 99.4 to the Current Report on Form 8-K, filed with the SEC on May 25, 2016, as such Risk Factors may be updated from time to time in subsequent reports. The Company does not assume any obligation to update any forward-looking statements, whether as a result of new information, future events or otherwise, except as required by law. Information in this presentation has been provided to NYRT by JBG in connection with the Combination Transactions subject to the terms of Combination Agreement. Certain of this information is based solely on JBG’s estimates using data available to JBG and assumptions made by JBG and JBG’s current business plans, which may change. In certain instances, these estimates and assumptions have been used as a basis to derive asset values and potential future Property-Level NOI. There can be no assurance that the assumptions or estimates used are accurate or that the asset values or potential future Property-Level NOI based on the assumptions or estimates will be achieved. Asset values and Property-Level NOI may also vary for a number of other reasons. You are cautioned not to place undue reliance on these estimates and assumptions or any information derived therefrom. For more information on the risks and uncertainties related to these estimates please see the risk factors included as Exhibit 99.4 to the Company’s Current Report on Form 8-K filed with the SEC on May 25, 2016.
D i s c l a i m e r
A d d i t i o n a l I n f o r m a t i o n A b o u t t h e P ro p o s e d Tra n s a c t i o n P ro p e r t y - L e v e l N O I G ro w t h E s t i m a t e s
The estimated growth in Property-Level NOI is based on JBG management’s estimates as to growth in its Property-Level NOI. This information is not an historical fact and should not be relied upon as being necessarily indicative of future results. The estimates are based on numerous assumptions that may not be accurate, including assumptions as to Property-Level NOI that will be generated from lease-up opportunities, assets under construction or redevelopment, assets for which development has been planned but not yet commenced and the land bank. These assumptions may prove to be wrong. The estimates are also based on the assumption that there will not be any property sales, although the combined company expects to make certain asset sales as part of its deleveraging strategy. Important factors that may cause actual Property-Level NOI to be substantially lower than the growth in Property-Level NOI estimated and assumed by JBG include, but are not limited to, risks and uncertainties relating to JBG and other factors described in the risk factors included as Exhibit 99.4 to the Company’s Current Report on Form 8-K filed with the SEC on May 25, 2016. The estimates also reflect assumptions as to certain business decisions that are subject to change. As a result, actual results may differ materially from those contained in the estimates. Accordingly, there can be no assurance that the estimates will be realized. In connection with the proposed transaction, the Company expects to file with the SEC relevant materials, including a definitive proxy statement which will be mailed or otherwise disseminated to the Company’s stockholders when it becomes available. THE COMPANY’S STOCKHOLDERS ARE ENCOURAGED TO READ THE PROXY STATEMENT AND OTHER RELEVANT DOCUMENTS FILED WITH THE SEC IF AND WHEN THEY BECOME AVAILABLE BECAUSE THEY WILL CONTAIN IMPORTANT INFORMATION. Investors may obtain free copies of the proxy statement and other relevant documents filed by the Company with the SEC (when they become available) through the website maintained by the SEC at www.sec.gov. Copies of the documents filed by the Company with the SEC are also available free of charge on the Company’s website at http://www.NYRT.com. This document does not constitute an offer to sell or the solicitation of an offer to buy the securities of the Company or the solicitation of any vote or approval. The issuance of common stock and OP Units in connection with the proposed transaction will be submitted to the stockholders of the Company for their approval.
D i s c l a i m e r ( C o n t ’ d ) M a r ke t D a t a
Market data and industry forecasts are used throughout this presentation. The Company has obtained certain market and industry information from market research prepared for JBG by Jones Lang LaSalle Americas, Inc., a nationally recognized real estate consulting firm. In addition, the Company has obtained certain market data from publicly available information and industry publications. These sources generally state that the information they provide has been obtained from sources believed to be reliable, but the accuracy and completeness of the information are not guaranteed. The forecasts and projections are based on industry surveys and the preparers’ experience in the industry and there is no assurance that any of the projections or forecasts will be achieved. The Company believes that the surveys and market research others have performed are reliable, but has not independently verified this information.
P a r t i c i p a n t s i n S o l i c i t a t i o n Re l a t i n g t o t h e P ro p o s e d Tra n s a c t i o n
The Company, JBG and their respective directors and executive officers may be deemed to be participants in the solicitation of proxies from Company’s stockholders in respect of the matters to be submitted to the stockholders of the Company for their approval in connection with the proposed transaction. Information regarding the Company’s directors and executive officers can be found in the Company’s Annual Report on Form 10-K for the year ended December 31, 2015 filed with the SEC on February 26, 2016. Information regarding JBG’s executive officers can be found on Exhibit 99.3 to the Company’s Current Report on Form 8-K filed with the SEC on May 25, 2016. Additional information regarding the interests of such potential participants will be included in the proxy statement and other relevant documents filed with the SEC in connection with the proposed transaction when they become available. These documents are available free of charge on the Company’s website and from the Company using the sources indicated above.
N o t e A b o u t J B G ’s P o r t f o l i o
Pursuant to the transaction agreement, the composition of JBG’s portfolio and the nature and amount of its interest in properties that comprise it are subject to change between now and completion of the proposed transaction. There can be no assurance that the transaction will close and, if it does, whether the properties discussed herein will be included as set forth herein or at all.
D i s c l a i m e r ( C o n t ’ d ) N o n - G A A P M e a s u re s
This document includes information derived from JBG’s Adjusted Historical Asset-Level NOI and Adjusted Historical Asset-Level NOI, Before Rent Abatements, which are Non-GAAP measures. JBG’s management uses these Non-GAAP measures as supplemental performance measures for its assets and believes they provide useful information to investors, but they may not be comparable to other real estate companies’ similarly captioned Non-GAAP measures, including any Non-GAAP measures used by the Company, and should be considered only as supplements to net operating income (loss) (computed in accordance with GAAP) as a measure of the operating performance of JBG’s assets. Additional information about these Non-GAAP measures, including a reconciliation to net operating income (loss) (computed in accordance with GAAP), can be found in Exhibit 99.3 to the Company’s Current Report on Form 8-K filed with the SEC on May 25, 2016. This document also includes information derived from the Company's Cash NOI which is a Non-GAAP measures. The Company's management uses Cash NOI as a supplemental performance measure for its assets and believes they provide useful information to investors, but it may not be comparable to
supplements to net operating income (loss) (computed in accordance with GAAP) as a measure of the operating performance of the Company assets. Additional information about Cash NOI, including a reconciliation to net operating income (loss) (computed in accordance with GAAP), can be found in the Company’s Quarterly Report on Form 10-Q filed with the SEC on May 10, 2016.
1
Situation Overview
NYRT considered various alternatives in order to achieve long-term maximum value for stockholders, including:
The ultimate goal of the process was to best maximize value for the Company over the long-term Goal
2
Strategic Alternatives
3
On October 1, 2015, NYRT announced its retention of the Eastdil Secured division of Wells Fargo Securities as strategic advisor to identify and evaluate potential strategic transactions at the entity
Background
1
There was a robust process in which over 60 potential investors signed corporate-level NDAs and
level NDAs) Process
4
The proposed transaction with JBG will best maximize value for the Company over the long-term Conclusion
5
2
Transaction Rationale
NYC and DC Focus Internalized Management Balance Risk Profiles Embedded Growth Scale On May 25, 2016, NYRT entered into a combination agreement with the JBG Companies that NYRT believes fulfills the goals of the NYRT strategic alternatives process and will maximize value for the Company over the long-term Combination with JBG creates a best-in-class urban, mixed-use REIT with a high-quality portfolio in New York City and Washington, DC, two of the most desirable institutional real estate investment markets in the US External management contract will terminate if the transaction closes, thereby improving alignment of stockholders with the management team and creating G&A savings Complementary portfolios with well-occupied, long-term leased New York REIT assets matched with higher growth JBG Washington, DC assets Combined company poised for significant near- and long-term internal growth through what we believe is an attractive in-place JBG development platform and pipeline
1 2 3 5
Gives the combined company scale which increases float, increases relevance to REIT investors and spreads G&A costs
6
Provides significant capital raising flexibility including institutional capital or public market capital to achieve overall lowest cost of capital Capital Raising Flexibility
4
3
Transaction Overview
Structure & Consideration
31, 2016 and closing
Pro Forma Ownership
approximately 65.2% for existing JBG equity holders(2)
company) will own approximately 15% of the combined company(3)
____________________ (1) Includes operating, construction, pre-development and land bank assets. (2) Ownership percentage and shares allocated to JBG based on estimate of outstanding NYRT Shares at close of 170.7M shares assuming conversion of LTIP Units and OP units. (3) Pro forma ownership percentages do not give effect to the incentive equity grants planned to occur shortly after closing. (4) Calculated as pro forma shares outstanding of 490.6M multiplied by NYRT closing share price of $9.77 on May 24, 2016 plus NYRT Net Debt of $1,182M and JBG Net Debt of $2,433M.
Pro Forma Capitalization Corporate Organization
$500M accordion feature which is required to be in place as a condition to the closing of the transaction to fund transaction costs and provide liquidity for the Company
Expected Closing
and OP units
Internalized Management
4
Transaction Overview (Cont ’d)
____________________ (1) Future dividends represent an estimate based on current expectations; however, all future dividends will be determined by the combined public company board of directors and will depend
Capital Recycling & Deleveraging Plan
facilitate near term deleveraging
Dividend
payout ratios
5
Who is JBG?
FULLY-INTEGRATED REAL ESTATE INVESTMENT COMPANY WITH 50+ YEAR TRACK RECORD
____________________ Note: Peer set data as of 3/31/2016 per latest SEC filings. (1) Statistics shown at pro rata share. (2) For VNO, BXP and PGRE, shows Washington, DC segment data.
# OPERATING ASSETS OPERATING SF CONSTRUCTION SF DC Peers(1)
JBG(1) 11.3M 1.2M 72 VNO(2) 16.3M 1.4M 71 BXP(2) 9.1M 1.0M 48 WRE 10.1M 0.1M 53 FPO 6.9M 0.3M 85 PGRE(2) 1.6M
integrated platform in DC Metro Area
populated, Metro-accessible, urban infill submarkets
high-quality development pipeline and embedded infill land bank
growth
record, extensive experience and substantial economic alignment
National Developer of the Year (2012) Sustainable Development Award (2014) One of the Top Consistent Performing Closed-End Private Real Estate Fund Managers since 2011
JBG Opportunity Funds Vintage Equity Estimated Leverage Number of Investments Equity Invested Average Hold Period Gross Levered IRR Equity Multiple Fund I 1999 $28M 75.2% 29 $29M 4.9 35.6% 5.0x Fund II 2002 $29M 72.6% 9 $22M 4.2 41.3% 3.4x Fund III 2002 $210M 64.6% 15 $116M 4.2 46.2% 4.3x Fund IV 2004 $250M 66.1% 14 $157M 4.4 31.8% 2.3x Fund V 2005 $528M 58.9% 30 $434M 2.6 39.6% 1.6x Fund VI 2007 $600M 63.2% 18 $165M 5.2 2.8% 1.2x Fund VII 2008 $576M 55.9% 13 $87M 4.1 36.9% 3.6x Fund VIII 2011 $753M 55.6% 4 $75M 3.1 34.8% 2.3x Fund IX 2014 $680M – – – – – –
AGGREGATE (I - IX)
59.7% 132 $1.1B 4.1 36.6% 2.3x SINCE
O P P O R T U N I T Y F U N D S
EQUITY RAISED INVESTMENTS INVESTMENTS SOLD EQUITY BASIS SOLD EQUITY MULTIPLE
GROSS LEVERAGED IRR
R E A L I Z E D I N V E S T M E N T S
6
Proven Stewards of Capital
TRACK RECORD OF OUTSIZED RISK-ADJUSTED RETURNS IN THE WASHINGTON, DC MARKET Over
____________________ Note: There can be no assurance that the combined company will be able to replicate the performance achieved by the JBG funds with respect to the historical gross levered IRRs and equity multiples achieved by the JBG funds with respect to realized investments. The historical gross levered IRRs and equity multiples do not reflect the impact of carried interests or asset management fees, as applicable, paid to JBG or cash based general and administrative expenses we would expect the combined company to incur in the future in connection with the operation of these assets.
7
JBG Strategy - What Makes Us Different
Concentrate investment in urban submarkets in path of growth with sustainable long-term advantages Target investments with asymmetric risk profiles that provide substantial upside and limited downside Execute “Placemaking™” strategy through dedicated mixed-use teams to generate premium asset values
PURE-PLAY ― URBAN ― MIXED-USE
Focus on risk-adjusted returns and efficient capital allocation with opportunistic use of joint ventures
Collaborative culture with broad ownership participation and focus on investor alignment
8
New York City Expansion a Strategic and Logical Step for JBG
NYC Expansion Has Been in the Works
We Have the Platform and Skill Sets to Compete in NYC
immediate scale to support a full local team and a strong base for expansion
Clear Path to Integrate and Grow NYC Platform
transition
property management
and lease-up
Plaza option
properties with long-term redevelopment potential Near-term Opportunities Long-term Opportunities
Management and Inside Directors Age Years with JBG Years in Industry Experience Executive Management Matthew Kelly Chief Executive Officer & Inside Director 43 12 18 Has worked at The JBG Companies since 2004 and serves as a Managing Partner and a member of JBG’s Executive Committee and Investment Committee James Iker Chief Investment Officer & Interim Chief Financial Officer 43 14 21 Has worked at The JBG Companies since 2002 and serves as a Managing Partner and a member of JBG’s Executive Committee and Investment Committee David Paul President & Chief Operating Officer 53 9 25 Has worked at The JBG Companies since 2007 and serves as a Managing Partner and a member of JBG’s Executive Committee and Investment Committee Brian Coulter Chief Development Officer 56 29 31 Has worked at The JBG Companies since 1986 and serves as a Managing Partner and a member of JBG’s Executive Committee and Investment Committee Inside Directors(1) Michael Glosserman Co-Chairman of the Board 70 37 43 Has worked at The JBG Companies since 1979 and serves as a Managing Partner, a member of JBG’s Investment Committee and Chair of JBG’s Executive Committee. Board Member of the CoStar Group since 2008 Robert Stewart Co-Chairman of the Board 54 28 30 Has worked at The JBG Companies since 1988 and serves as a Managing Partner, a member of JBG’s Executive Committee and Chair of JBG’s Investment Committee
9
Multi-Generational Management Team With Proven Record
~15% Management and Insider Ownership(2)
____________________ (1) Matthew Kelly, Chief Executive Officer, will also serve as an inside director. (2) Includes executive officers, inside directors and additional current JBG employees. Pro forma ownership percentages do not give effect to the incentive equity grants planned to occur shortly after closing.
Independent Directors Age Experience
Glenn Hutchins Lead Independent Director 60 Chairman of North Island and Co-Founder of Silver Lake. Serves as independent director of AT&T and Nasdaq, Inc. and director of the Federal Reserve Bank of New York and as Vice Chairman of the Brookings Institution and the Economic Club of New York Michael Barnello Independent Director 50 President and Chief Executive Officer of LaSalle Hotel Properties (NYSE: LHO) since 2009 Jamie Behar Independent Director 59 Former Managing Director, Real Estate & Alternative Investments, for General Motors Investment Management Corporation from 2005 to 2015 and Portfolio Manager since 1986. Serves as an Independent Director of Sunstone Hotel Investors, Inc. (NYSE: SHO) and Gramercy Property Trust (NYSE: GPT) Scott Estes Independent Director 45 Executive Vice President and Chief Financial Officer of Welltower Inc. (NYSE: HCN) since 2009 Alan Forman Independent Director 50 Yale University Investments Office since 1990, Director of Real Assets and
Kimpton Group Holdings and former director of Acadia Realty Trust (NYSE: AKR) Randolph Read Independent Director 63 Current Chairman of the New York REIT Board and non-Executive Chairman of Healthcare Trust, Inc. since 2015. Formerly President of the Greenspun Corporation, which included real estate owner/developer American Nevada
10
Well Respected Board of Directors
Board of Directors designed for best-in-class Corporate Governance and Stockholder Alignment
Majority Independent Non-staggered Board
100% Stock Compensation
Stockholder Friendly Anti- Takeover Provisions
Intend to Opt- Out of MUTA
Post-Closing Intent:
11
Pro Forma Capitalization
____________________ Note: Data shown at pro rata share. (1) Pro forma Total Enterprise Value does not include $142M of additional equity to be invested (including operating cash flow) between 3/31/16 and closing. (2) NYRT Current Share Price used as a proxy for JBG’s standalone Equity Market Capitalization. There can be no assurance that JBG’s Equity Market Capitalization would be based on NYRT’s Current Share Price. (3) Total Debt includes pro rata share of property-level debt. Note: excludes the effect of the intended new credit facility of $1.0B which will be used to pay transaction costs, refinance certain property-level debt and NYRT’s existing term loans and revolving credit facility.
NYRT Standalone JBG Standalone Combination(1)
As of 3/31/2016 Pro Forma Stock Price (As of close on 5/24/2016) $9.77 $9.77 $9.77 x Fully Diluted Shares Outstanding (in millions) 170.7 319.9 490.6 Equity Market Capitalization $1,668.1M $3,125.5M $4,793.6M Total Debt $1,282.3M $2,483.5M $3,765.8M Less: Cash and Cash Equivalents (100.2) (50.6) (150.8) Net Debt $1,182.1M $2,432.9M $3,615.0M Total Enterprise Value ("TEV") $2,850.2M $5,558.4M $8,408.6M Net Debt / TEV 41% 44% 43%
(2) (3)
LAND BANK
ASSETS BUILT/RENOVATED SINCE 2005
OPERATING
EMBEDDED FUTURE GROWTH PIPELINE IN
OPERATING ASSETS AVERAGE AGE
IN 2020
ASSETS INSIDE THE BELTWAY OR METRO-SERVED
CONST./PREDEV
12
SCALE AND DIVERSITY TO COMPETE WITH BEST-IN-CLASS OPERATORS IN GATEWAY MARKETS
Combined Portfolio Highlights
Washington, DC New York City
ASSETS BUILT/RENOVATED SINCE 2005
OPERATING
PRIME NYC SUBMARKETS
____________________ (1) Excludes Viceroy Hotel. (2) Calculation excludes assets held for redevelopment. (3) Assumes completion of all construction and pre-development projects. (4) Assumes portfolio stays static other than the completion of the construction and pre-development assets. (5) Estimated potential density at pro rata share.
(3) (5) (2) (1) (4)
Strong Combined Footprint in Two Gateway Markets
STRATEGICALLY LOCATED ASSETS IN THE PATH OF GROWTH
MIDTOWN EAST 81K SF MIDTOWN WEST 1.4M SF MIDTOWN 43K SF GARMENT DISTRICT 268K SF TIMES SQUARE SOUTH 752K SF CHELSEA 447K SF GREENWICH VILLAGE 33K SF TRIBECA 168K SF SHADY GROVE 586K SF RESTON 1.4M SF NORTH ROCKVILLE 263K SF ROCKVILLE PIKE CORRIDOR 1.3M SF BETHESDA 717K SF SILVER SPRING 342K SF ANNANDALE 358K SF TYSONS CORNER 19K SF MCLEAN 170K SF CHEVY CHASE 25K SF TAKOMA 124K SF BROOKLAND/ FORT TOTTEN 124K SF RB CORRIDOR 888K SF GEORGETOWN 545K SF U STREET/SHAW 467K SF UPTOWN 293K SF SOUTHEAST 2.1M SF POTOMAC YARD 40K SF CBD 294K SF NoMA 208K SF SOUTHWEST 438K SF CAPITOL HILL 208K SF I-395 CORRIDOR 2.2M SF EISENHOWER AVE. 25K SF VIENNA 25K SF
Portfolio concentrated on the West Side where tenant demand in Manhattan is prominent
NEW YORK CITY
Portfolio concentration around transit-oriented centers with nearly 90% of SF Inside Beltway and/or Metro-served
WASHINGTON, DC
Note: All statistics pro rata. Square footage shown for operating, under construction and pre-development assets. Brooklyn, LaPlata, Pikesville, Rt. 28 South/Chantilly and Woodbridge Not Shown (Off Map).
13
14
Significantly Improves Scale and Diversity
SCALE AND DIVERSITY TO COMPETE WITH BEST-IN-CLASS OPERATORS IN GATEWAY MARKETS
NYRT Standalone(1)
Total Operating Assets Total Operating SF(2) 18
____________________ Note: Data shown at pro rata except for leased and pre-leased portfolio statistics. (1) Data excludes Viceroy Hotel. (2) SF shown at pro rata share. (3) Occupancy as of March 31, 2016, inclusive of leases signed but not yet commenced. (4) Weighted average calculation excludes multifamily assets. (5) 1Q16 annualized NOI of office and stand-alone retail portfolios for NYRT including free rent and annualized adjusted historical asset-level 1Q16 NOI annualized for JBG, excluding management company.
JBG Standalone Combination(1)
NOI by Asset Type(5) Operating Portfolio Leased %(3) SF Under Construction(2) / Pre-Lease % 3.2M 96.3%
72 11.3M 90.1% 1.2M / 52.8%(4) 90 14.5M 91.4% 1.2M / 52.8%(4)
$115M Pro Rata NOI
NYC Office 87% NYC Retail 13%
$200M Pro Rata NOI
DC Office 72% DC Multifamily 21% DC Retail 7%
$315M Pro Rata NOI
DC Office 45% NYC Office 32% DC Multifamily 13% DC Retail 5% NYC Retail 5%
NOI by Location(5)
$115M Pro Rata NOI
NYC 100%
$200M Pro Rata NOI
DC 100%
$315M Pro Rata NOI
DC 63% NYC 37%
Pre-Development Pipeline (SF)(2)
1.4M Land Parcels / Estimated Potential Density (SF)(2)
41 / 14.8M 41 / 14.8M
$2.9B $6.7B $6.8B $8.4B $10.8B $22.6B $30.6B $35.0B Standalone NYRT ESRT PGRE Pro Forma JBG Combination DEI SLG BXP VNO
Substantially increases scale to compete with high-barrier, gateway market-focused mid and large cap peers
15
____________________ Source: Company SEC filings. Market data as of May 24, 2016. Note: TEV defined as Market Value + Debt + Preferred Stock + Minority Interest - Cash and Equivalents. Proportionate share of Joint Venture debt and debt related to subsequent events included where appropriate and available. (1) Total Enterprise Value calculated as pro forma shares outstanding of 490.6M multiplied by NYRT closing share price of $9.77 on May 24, 2016 plus NYRT Net Debt of $1,182M and JBG Net Debt of $2,433M.
Total Enterprise Value
Significantly Improves Scale
SCALE TO COMPETE WITH BEST-IN-CLASS OPERATORS IN GATEWAY MARKETS
(1)
630 520 649 296 590 2016 2017 2018 2019 2020
DC Office DC Retail NYC Office NYC Retail
6.0% 4.9% 6.1% 2.8% 5.6%
16
Well-Leased Office And Retail Operating Portfolio Provides Baseline Stability
Annualized Percent of Total SF Rent Combined At Share At Share Annualized Top 10 Tenants (000s) ($000s)(2) Rent(2) 1. 3,494 $127,565 29.6% 2. 302 29,273 6.8% 3. 401 19,330 4.5% 4. 215 14,884 3.5% 5. 203 12,102 2.8% 6. 144 8,916 2.1% 7. 159 7,916 1.8% 8. 103 5,379 1.2% 9. 161 4,810 1.1% 10. 60 4,658 1.1% Total Top 10 Tenants 5,241 $234,833 54.5%
Combined Company Top Office and Retail Tenants Combined Company Office and Retail Lease Expiration Schedule(1)
approximately 30% of Annualized Rent)
% Combined Lease Expiration SF in 000s ____________________ Source: Company Filings as of March 31, 2016 for NYRT. (1) SF shown at share. NYRT figures excludes Viceroy Hotel. (2) Top office and retail tenants by annualized rent on a combined basis.
17
Washington, DC Growth Prospects
SUBSTANTIAL POTENTIAL GROWTH THROUGH LEASE-UP, HIGH-QUALITY DEVELOPMENT PIPELINE AND EMBEDDED INFILL LAND BANK
Contractual
1
Near-term Growth
2
Long-term Growth
3
burn-off of free rent(2)
Beltway and/or Metro served
~$14M of potential pro rata NOI from pro rata contractual rent of $21M(5)
leased office(6)
estimated potential density of ~15M pro rata SF
$391M
Signed But Not Yet Commenced Leases Burn off of Abatements Embedded Growth in Operating Portfolio Delivery of Assets Under Construction Pre-Development Pipeline Land Bank
(1) Represents base rent before abatements and straight line rent adjustments, plus estimated tenant reimbursements for the month in which the lease commences, multiplied by twelve. Triple net leases are converted to a gross basis by adding estimated tenant reimbursements to base rent. Assumes 65% NOI margin on 16th & I Street and 90% NOI margin on remaining leases. (2) Represents contractual rent abatements in the three months ended March 31, 2016 multiplied by four. (3) Weighted average percent leased based on total RSF. (4) Incremental rent from lease up from percentage leased as of March 31, 2016 to weighted average submarket percentage leased at weighted average submarket rent per SF for office, comparable competitive set leased and competitive set rent per unit for multifamily, or weighted average submarket percentage leased at in-place rent for retail assets and 90% NOI margin. (5) Assumes 65% NOI margin on CEB Tower at Central Place. (6) Represents pro rata share of NOI based on the midpoint of the targeted NOI yield on construction and pre-development properties at stabilization. Office NOI excludes space contractually pre-leased as of March 31, 2016.
by March 31, 2017
contractual rent of ~$9M
assets are ~55.6% leased(3)
pro rata rent of ~$17M(4)
a position to commence construction by March 31, 2017
____________________ Note: Information as of March 31, 2016. Lease-Up Disclaimer: This information is based on JBG’s estimates and assumptions. There can be no assurance that the actual amount of potential incremental annualized rent from lease up opportunities generated by the relevant assets will not be substantially lower. The ability to achieve these lease percentages and rental rates may be adversely affected by an increase in supply or deterioration in the office, retail or multifamily market, competition, difficulties attracting new tenants or retaining existing tenants and other factors. Construction/Pre-Development Disclaimer: This information is based on target yields and other estimates made by JBG for assets planned for redevelopment, construction assets and pre-development assets. There can be no assurance that the actual amount of NOI generated by the relevant assets will not be substantially lower based on numerous other factors, including delays or difficulties in leasing and stabilizing these assets, failure to obtain estimated occupancy and rental rates, inability to collect anticipated rental revenues, tenant bankruptcies and unanticipated expenses at these assets that cannot be passed on to tenants. Land Bank Disclaimer: This information is based on JBG’s estimates and assumptions. There can be no assurance that the actual density will not be substantially lower based on numerous factors, including the inability to obtain necessary zoning, land use and other required entitlements, as well as building, occupancy and other required governmental permits and authorizations and changes in the entitlement, permitting and authorization processes that restrict or delay the ability to develop, redevelop or use the land bank at anticipated density levels. The estimated value contemplates estimates of any entitlement costs, option payments, ground lease payments or other costs required to access the estimated potential density.
$115M $115M $115M $200M $220M $351M $315M $7M $13M $335M $15M $49M $67M $466M
Annualized 1Q16 Combined Property NOI Signed Leases Commencing after 1Q16 Burnoff of Abatements Forward Contractual Property NOI Embedded Growth NOI from Assets Under Construction NOI from Assets in Pre-Development Pipeline Future Property NOI Potential
JBG (1) NYRT (2) NYRT (2) NYRT (2) NYRT (2) JBG JBG
18
Washington, DC Growth Prospects (Cont ’d)
SUBSTANTIAL POTENTIAL GROWTH THROUGH LEASE-UP AND HIGH-QUALITY DEVELOPMENT PIPELINE
(1) Adjusted historical asset-level NOI for the three months ended March 31, 2016 at JBG’s pro rata share based on JBG’s ownership percentage as of March 31, 2016 multiplied by four. (2) 1Q16 annualized Cash NOI of office and stand-alone retail portfolios for NYRT including free rent. Excludes Viceroy Hotel. (3) Represents base rent before abatements and straight line rent adjustments, plus JBG’s estimated tenant reimbursements for the month in which the lease commences, multiplied by twelve. Triple net leases are converted to a gross basis by adding JBG’s estimated tenant reimbursements to base rent. Assumes 65% NOI margin on 16th & I Street and 90% NOI margin on remaining leases. (4) Represents contractual rent abatements in the three months ended March 31, 2016 multiplied by four. (5) Incremental rent from lease up from percentage leased as of March 31, 2016 to weighted average submarket/comp set percentage leased at weighted average comp set/in-place rent per SF and 90% NOI margin. Includes $7.9M of Office, $6.1M of Multifamily and $1.4M of Retail NOI growth.
(3) (4) (5)
(6) Represents pro rata share of NOI based on the midpoint of the targeted NOI yield on construction and pre-development assets at stabilization. $12.9M of Office, $19.2M of Multifamily and $3.2M
(7) Assumes 65% NOI margin on CEB Tower at Central Place. Includes $14.1M of Office NOI growth. (8) Represents pro rata share of NOI based on the midpoint of the targeted NOI yield on construction and pre-development assets at stabilization. $33.4M of Office, $31.8M of Multifamily and $1.3M
(9) Includes JBG’s estimated cost to stabilize for operating portfolio as well as remaining cost to complete for construction and pre-development portfolio. More details can be found on page 29.
(8) (6)
Contractual
1
Near-term Growth Long-term Growth
2 3
CEB Tower ($14M) 65% Pre-leased
(7)
Office ($68M) Multifamily ($57M) Retail ($6M) Product Type (NOI Growth)
(6) (7) (7)
Total Estimated Cost to Stabilize ($1,088M) (9)
Property-Level Net Operating Income (NOI)
retail leases, and JBG’s largest GSA lease, contain contractual rent escalators ranging from 2.0% - 3.0% per annum
____________________ Note: Number may not add due to rounding. Table is illustrative of potential future NOI growth in the JBG portfolio based on various assumptions, including those set forth on this page. This illustration assumes a static portfolio other than the completion of construction and pre-development assets. Among other factors that are not accounted for in this illustration are future abatements, lease terminations or non-renewals and asset sales. As disclosed elsewhere, out business plan is to sell between $1.5 - $2.0B of assets. Property-Level NOI Growth Estimates Disclaimer: The estimated growth in Property-Level NOI is based on JBG management’s estimates as to growth in its Property-Level NOI. This information is not an historical fact and should not be relied upon as being necessarily indicative of future results. The estimates are based on numerous assumptions that may not be accurate, including assumptions as to Property-Level NOI that will be generated from lease-up opportunities, assets under construction or redevelopment, assets for which development has been planned but not yet commenced and the land bank. These assumptions may prove to be wrong. The estimates are also based on the assumption that there will not be any property sales, although the combined company expects to make certain asset sales as part of its deleveraging strategy. Important factors that may cause actual Property-Level NOI to be substantially lower than the growth in Property-Level NOI estimated and assumed by JBG include, but are not limited to, risks and uncertainties relating to JBG and other factors described in the risk factors included as Exhibit 99.4 to the Company’s Current Report on Form 8-K filed with the SEC on May 25, 2016. The estimates also reflect assumptions as to certain business decisions that are subject to change. As a result, actual results may differ materially from those contained in the estimates. Accordingly, there can be no assurance that the estimates will be realized.
Well-Located Land Bank and Other Opportunities Support Long-term Growth
19
____________________ Land Bank Disclaimer: This information is based on JBG’s estimates and assumptions. There can be no assurance that the actual density will not be substantially lower based on numerous factors, including the inability to obtain necessary zoning, land use and other required entitlements, as well as building, occupancy and other required governmental permits and authorizations, and changes in the entitlement, permitting and authorization processes that restrict or delay the ability to develop, redevelop or use the land bank at anticipated density levels. The estimated value contemplates estimates of any entitlement costs, option payments, ground lease payments or other costs required to access the estimated potential density. Note: Woodbridge (Prince William County) assets not shown.
LEGEND
BUBBLE SIZE = JBG CONCENTRATION AT SHARE = CAPITAL BELTWAY
LAND ASSETS SHOWN
Activate Substantial Land Bank Land Bank will continue to support incremental development activity well into the future and allows for substantial
1
Opportunistically Pursue Acquisitions In-depth market knowledge and extensive network of long- standing relationships provides access to a pipeline of attractive acquisition and investment opportunities Build-to-suit GSA Well positioned to capture build-to-suit GSA opportunities, with anticipated GSA lease expirations totaling 28.0M RSF
2 3 4 Land Bank Composition
Pro Rata Estimated Potential Density (SF) Pro Rata Estimated Value(1) Washington DC 3.0M $96.2M Virginia 8.9M 232.2M Maryland 2.9M 62.8M Total 14.8M $391.2M
ROCKVILLE PIKE CORRIDOR $29.5M RESTON $98.2M I-395 CORRIDOR $16.3M POTOMAC YARD $50.7M ALEXANDRIA $489K SILVER SPRING $32.7M BRANCH AVENUE CORRIDOR $578K RB CORRIDOR $4.4M WASHINGTON, DC $96.2M TYSONS CORNER $61.9M
Strategic Capital Business
SIGNIFICANT THIRD-PARTY MANAGEMENT BUSINESS PROVIDES STRATEGIC BENEFITS AND MEANINGFUL REVENUE OUT OF THE GATE
Strong institutional capital relationships provide access to private capital markets opportunistically Strategic capital business provides opportunity to access capital through potential joint ventures for deleveraging and to enhance returns Allows company to achieve scale and efficiency in operating and development platform at minimal cost to the REIT Diversified services platform and joint venture relationships provide predictable, stable income streams Scale provides market knowledge, buying power and operating efficiencies across all product types
Construction Management & Development Fees 30% Asset Management Fees 29% Property Management & Leasing Fees 34%
7%
20
2015 Third-Party Revenue to the REIT By Service Type ($49.0M)(1)
____________________ Note: Dollar in millions. (1) After eliminating fees earned for management of assets that will be acquired by NYRT in the combination transactions and that are expected to be consolidated in NYRT’s financial statements on a going forward basis. On the basis of cash received, fees earned for the management of assets on a pro rata basis would be $48.4M for the year ended December 31, 2015. (2) Gross Asset Value (GAV) of JBG Legacy Fund Assets based on 4Q15 JBG Opportunity Fund Fair Market Value Reports, REIT Joint Venture Partner interest GAV based on Joint Venture Partner’s ownership share of Estimated Value.
2 1 3 4 5
Strategic Capital Assets Under Management ($4.3B)(2)
Legacy Fund Assets $1.8B REIT JV Partner Interest $2.5B
$327M $781M $540M $386M $115M $1,616M 2016 2017 2018 2019 2020 Thereafter Wholly Owned Consolidated JV Non-Consolidated JV Term Loans Revolver
12 23 8 6 6 24
Balance Sheet and Financial Highlights
$1.0B with an accordion feature of up to $500M, the closing of which is a condition to the closing of the combination (currently have a signed term sheet)
transaction costs and refinance certain secured debt to support an unencumbered asset base
capacity on 8 existing construction lines providing additional liquidity to fund our growth
to delever the balance sheet and provide further liquidity
$1.3B
Secured 62% Unsecured 38%
$2.5B
Secured 100%
21
Pro Forma Debt Summary
$3.8B
Secured 87% Unsecured 13%
Secured vs. Unsecured Pro Rata Total Debt Debt Maturity Schedule(1)
# of Loans Maturing: Total Outstanding:
____________________ Note: Above tables are based on credit limits under loans as of March 31, 2016. Note: Dollars in millions. All figures at share, reflects pro rata share of joint venture assets. Balances as of March 31, 2016. Bars reflect current funded amounts at initial maturity date and do not reflect interim amortization. (1) Excludes new credit facility of $1.0B which will be used to pay transaction costs, refinance certain property-level debt and NYRT’s existing term loans and revolving credit facility.
The JBG Companies NYRT Pro forma Combination
Pro Rata Net Debt: $1.2B $2.4B $3.6B $100.2M $50.6M $150.8M Cash and Cash Equivalents:
(At Close) Asset Sales Organic Growth & Delivery of Development Pipeline Target Net Debt / EBITDA 11.0x - 12.0x 2.0x - 2.5x 2.0x - 2.5x 7.0x - 8.0x Development Adjusted: 9.5x - 10.5x
(~43% Net Debt / TEV)
22
Pathway Toward Target Long -term Conservative Balance Sheet
Planned asset sales and joint ventures of both NYRT and JBG assets post-combination will allow us to retire debt and significantly increase balance sheet capacity to fund future growth
Net Debt / LQA EBITDA
capital across our portfolio to deleverage and provide balance sheet capacity to maximize risk-adjusted returns for investors
assets that present attractive valuations in the private market
strategically with private capital to reduce our capital commitments while retaining growth in select build-to-core developments
equity issuances
(3) ____________________ (1) Development adjusted multiple assumes allocation of debt at 50% of historical cost on development and other non-stabilized assets and adjustment of corresponding NOI. (2) Assumes pre-closing sale of the Viceroy Hotel and 1100 Kings Highway. (3) Represents impact of incremental EBITDA net of incremental spend to fund growth and development. (2)
PATHWAY TO CONSERVATIVE BALANCE SHEET
18 - 24 Month Target 36 - 48 Month Target
(1)
23
Clear Pathway Toward Target Conservative Balance Sheet
assets that are not core to our mixed-use Placemaking™ strategy or in key growth submarkets
assets in our development pipeline in order to de-risk and maintain balance sheet flexibility while retaining upside
assets in the portfolio that we believe present the lowest go- forward risk-adjusted returns
with further detail regarding our deleveraging plans in the coming months Suburban Class B Residential Suburban GSA Office Suburban Non-Core Retail Viceroy Hotel NYC Retail Select Office / Multifamily
Possible Sale
OVER
OF LIQUID “CHOICES” Possible Recapitalization
Build-to-Core Office Build-to-Core Multifamily Select Office / Multifamily Goal of monetizing $1.5 - $2.0B of assets will help reach targeted leverage of 7.0x - 8.0x EBITDA while maintaining sufficient scale to achieve investment objectives
24
Strategic Plan - Key Priorities
Strengthen and delever balance sheet via non-core asset sales and strategic recapitalizations to achieve target leverage of 7.0x - 8.0x
2
Integrate operations and culture
1
Execute on high-quality, Washington, DC growth pipeline
3
Extend DC competitive advantages in urban infill, mixed-use to the NYC market
4
Pursue longer-term growth opportunities, including maximization of substantial land bank and value-enhancing acquisitions in both DC and NYC
5
LASER FOCUSED ON NEAR-TERM PRIORITIES WITH EMBEDDED CAPABILITIES AND OPPORTUNITIES TO DRIVE LONG-TERM VALUE CREATION
25
Platform Integration and New York City Strategy
Todd Rich (JBG Partner in Investments group) will lead integration efforts and will be based in NYC office
and has experience in the New York metro area Maintain a dedicated New York City office presence with the existing New York REIT on-the-ground asset management and investments team remaining in place Integrate New York City asset level accounting and financial reporting into JBG infrastructure Build NYC-based in-house property management capability to internalize property management Build NYC-based in-house development and leasing capability to enhance ability to pursue new
Our investment goal over time is to build similar scale to our DC business across a mix of product types and with a similar strategy
IMMEDIATE (3 - 6 months) SHORT - MEDIUM TERM (12 - 18 months) MEDIUM - LONG TERM (18+ months) LONG TERM
WELL-DEFINED NEAR-TERM INTEGRATION PLAN AND MEDIUM- TO LONG-TERM STRATEGY
26
Transaction Conclusions
Intend to have best-in-class REIT featuring portfolio in prime high-barrier markets of New York City and Washington, DC
1
Significant management ownership and intended best-in-class corporate governance aligns stockholders with management team
2
Complementary portfolios with well-occupied, long-term leased New York REIT assets matched with higher growth JBG Washington, DC assets
3
Significant near- and long-term embedded growth opportunity via what we believe are attractive JBG development platform and pipeline
4
Scale and additional flexibility for capital allocation within the combined portfolio
5
27
Permanent capital base to exploit JBG’s multi-phase Placemaking™ strategy without limitations of a closed- end fund structure Access to the most efficient equity and debt sources to capitalize on expanding opportunity set in DC and NYC Substantially improves alignment between management team and investors JBG’s Strategic Goals Have Led it to the Public REIT Format
JBG Public Market Rationale
STRATEGIC COMBINATION POISED TO MAXIMIZE FUTURE GROWTH
Provides significant scale that will support a fully integrated platform Superior alternative for existing JBG equity holders to a dilutive equity issuance through an IPO Provides platform and low-risk, core asset base in NYC to methodically expand Placemaking™ strategy Combination Achieves Strategic Goals of Accessing Public Market and Expansion of Platform to New York City
28
JBG Implied Value Build-Up
Share Price: (1) $9.77 - $12.50 Total Shares to JBG: 319.9M Implied Equity Value: $3,126M - $3,999M Plus: Net Debt: (2) $2,433M Less: Other (Assets) / Liabilities: (3) ($84M) Implied Gross Asset Value: $5,474M - $6,347M COMPONENTS OF VALUE Less: Value of Strategic Capital Business (3.0x - 7.0x Revenue) : (4) ($147M - $343M) Less: Land Bank: (5) ($391M) Implied Gross Real Estate Value: $4,936M - $5,613M Operating Construction Pre-Development Implied Gross Real Estate Value: $4,186M - $4,678M $420M - $506M $330M - $429M Stabilized NOI: (6) $235M $49M $67M (Cost to Stabilize): ($16M) ($392M) ($680M) Implied Cap Rate/Yield: (7) 5.6% - 5.0% 6.1% - 5.5% 6.6% - 6.0%
____________________ Value Disclaimer: The values shown in the table represents JBG management’s estimate of the values of its properties and assets and is based on numerous assumptions, some of which are set forth herein. These assumptions may prove to be wrong. The assessment of fair value is subjective in that it involves estimates and can be calculated using various methods. Accordingly, there can be no assurance that the values set forth herein represent the actual value of JBG’s assets or the amount that could be realized on a sale of those assets. Property-Level NOI Growth Estimates Disclaimer: The estimated growth in Property-Level NOI is based on JBG management’s estimates as to growth in its Property-Level NOI. This information is not an historical fact and should not be relied upon as being necessarily indicative of future results. The estimates are based on numerous assumptions that may not be accurate, including assumptions as to Property-Level NOI that will be generated from lease-up opportunities, assets under construction or redevelopment, assets for which development has been planned but not yet commenced and the land bank. These assumptions may prove to be wrong. The estimates are also based on the assumption that there will not be any property sales, although the combined company expects to make certain asset sales as part of its deleveraging strategy. Important factors that may cause actual Property-Level NOI to be substantially lower than the growth in Property-Level NOI estimated and assumed by JBG include, but are not limited to, risks and uncertainties relating to JBG and other factors described in the risk factors included as Exhibit 99.4 to the Company’s Current Report on Form 8-K filed with the SEC on May 25, 2016. The estimates also reflect assumptions as to certain business decisions that are subject to change. As a result, actual results may differ materially from those contained in the estimates. Accordingly, there can be no assurance that the estimates will be realized. (1) Share Price based on a range from NYRT closing price as of $9.77 on May 24, 2016 to Research Analyst "Consensus NAV" of $12.50/Share, calculated as an average of $13.06/Share, $12.13/Share and $12.31/Share NAV research estimates from JMP Securities, Evercore ISI and SunTrust Robinson Humphrey, respectively, per SNL Financial. (2) JBG Net Debt includes pro rata share of property-level debt and $51M of cash and cash equivalents. (3) JBG other (assets) / liabilities includes $142M of additional equity to be invested (including operating cash flow) between 3/31/16 and closing, $35M of net tangible assets and capitalized value of JBG’s pro rata share of 9 months ended December 31, 2016 annualized ground rent expense at 5.0% cap rate. (4) Based on year ended December 31, 2015 revenues of $49.0M, after eliminating fees earned for management of assets that will be acquired by NYRT in the combination transactions and that are expected to be consolidated in NYRT’s financial statements on a going forward basis. On the basis of cash received, fees earned for the management of assets on a pro rata basis would be $48.4M for the year ended December 31, 2015. (5) Represents JBG management's estimate of value as of March 31, 2016. The value contemplates management’s estimate of any entitlement costs, option payments, ground lease payments or other costs required to access the estimated potential density. (6) JBG 1Q16 annualized NOI used for operating assets plus incremental NOI from lease-up for current vacancy. Construction and pre-development assets stabilized NOI calculated as the midpoint of the targeted NOI yield range multiplied by total cost per Exhibit 99.3 to the NYRT Current Report on Form 8-K, filed with the SEC on May 25, 2016. (7) Assumes 50bp yield premium over operating cap rate for construction assets and 100bp yield premium for pre-development assets.
29
JBG Portfolio Value Components
____________________ (1) Includes Stabilized, Stabilized-Embedded Growth and Recently Acquired/Delivered/Renovated assets. (2) Excludes incidental income contributing $1.0M of JBG share of 1Q16 annualized adjusted historical NOI, before rent abatements. (3) Base rent before rent abatements, plus tenant reimbursements for the quarter ended March 31, 2016, multiplied by four. Triple net leases are converted to a gross basis by adding tenant reimbursements to base rent. (4) JBG share of annualized adjusted historical NOI, before rent abatements. (5) Represents base rent before abatements and straight line rent adjustments, plus JBG’s estimated tenant reimbursements for the month in which the lease commences, multiplied by twelve. Triple net leases are converted to a gross basis by adding JBG’s estimated tenant reimbursements to base rent.
Assets Annualized Rent 1Q16 Annualized NOI RSF % Occupied Incremental Rent from Signed, Not Commenced Leases % Leased Potential Incremental Rent from Lease-Up to Submarket %
Stabilization
Office 38 $223.7M $152.4M 6.7M 90.5% $7.7M 92.2% $8.8M $13.5M P 32 - 36 Multifamily 19 $68.7M $43.2M 3.8M 82.4% $0.2M 86.1% $6.8M
Retail 15 $22.3M $16.0M 0.8M 87.8% $1.0M 91.9% $1.6M $2.2M P 32 - 36
Assets Weighted Avg. Stabilization Quarter Estimated Stabilized NOI RSF % Pre-Leased Cost to Date Cost Remaining Total Cost % Construction Complete
Office 1 4Q 2019 $27.0M 537K 65.0% $121.2M $219.7M $340.9M 25.8% P 37 - 38 Multifamily 4 3Q 2018 $19.2M 573K
$130.0M $264.8M 42.7% P 37 - 38 Retail 3 3Q 2018 $3.2M 66K 8.1% $21.7M $41.9M $63.7M 18.0% P 37 - 38 Office 4 2Q 2021 $33.4M 655K
$320.1M $409.5M
Multifamily 6 1Q 2020 $31.8M 736K 3.4% $65.6M $341.0M $406.6M
Retail 2 4Q 2020 $1.3M 40K 35.4% $14.2M $19.1M $33.2M
Operating Portfolio(1) Construction Portfolio Pre-Development Portfolio
(2)
All statistics shown as of the three months ended March 31, 2016 and at JBG’s pro rata share, except percent leased and occupied
(3)
(6) Calculated as the product of incremental SF available for lease up to the submarket percentage leased and weighted average competitive set rent per SF. Excludes potential revenue from leases signed but not commenced. (7) Source: JLL. Represents submarket average tenant improvement allowance and typical tenant representation commission as estimated by JLL. Tenant improvement allowance figures based on lease comparables within the designated submarket for relocations of 10 years or longer, excluding renewals and subleases. (8) JBG management’s estimate of quarter in which properties reach 90% occupancy, weighted by estimated stabilized NOI. (9) Represents the midpoint of JBG estimated targeted NOI yield multiplied by estimated total cost. (10) Calculated as the cost to date excluding land value divided by the total cost excluding land value.
(4) (5) (6) (7) (8) (9) (10)
30
JBG Portfolio Value Components (Cont ’d)
Assets Estimated Value
Density % Office % Multifamily % Retail
DC 10 $96.2M 3.0M SF 43.7% 49.2% 7.1% P 19, 41 VA 20 $232.2M 8.9M SF 37.7% 56.2% 6.1% P 19, 41 MD 11 $62.8M 2.9M SF 40.7% 52.5% 6.8% P 19, 41 Strategic Capital Business
P 20 Net Debt P 11, 28 Other Assets / Liabilities
Land Bank
All statistics shown as of the three months ended March 31, 2016 and at JBG’s pro rata share
____________________ (1) Represents JBG management's estimate of value as of March 31, 2016. The value contemplates JBG management’s estimate of any entitlement costs, option payments, ground lease payments or other costs required to access the estimated potential density. As these costs are incurred, the value may increase. (2) Reflects JBG management’s estimate of developable SF based on its current business plans as of March 31, 2016. JBG management’s estimates of potential densities are not, in all cases, the estimated maximum density, but rather are based on various factors, including market demand and current business plans. The estimated densities also are subject to final plan approvals by the relevant governmental authority in which the project is located. As a result of these densities being based on JBG management’s plans and final governmental approval, JBG management cannot provide any assurances that the outlined allowable densities will be achieved. JBG’s land bank includes 11 parcels attached to JBG’s existing operating assets that would require a redevelopment of approximately 532,000 office and/or retail SF and 1,160 multifamily units in order to access approximately 7.2M SF of total estimated potential density. (3) Represents the percent of JBG’s estimated potential density to be developed by asset class under current business plans as of March 31, 2016. (4) Revenue based on third parties and joint ventures that are expected not to be consolidated post-combination. (5) Additional equity to be invested (including operating cash flow) between 3/31/2016 and closing. (6) Net tangible assets / (liabilities) $85.6M, excluding cash of $50.6M. (7) JBG’s pro rata share of 9 months ended December 31, 2016 annualized ground rent expense.
(1) (2) (3) (3) (3) (7) (5) (4) (6)
JBG’s Best-In-Class Portfolio Across Major Asset Classes
PREMIER PORTFOLIO OF DIVERSIFIED, HIGH-QUALITY ASSETS IN ATTRACTIVE SUBMARKETS
densely populated urban infill submarkets that exhibit:
development due to limited available land and/or entitlement constraints
walkability
amenities
submarkets have experienced an 8.4% increase in asking rents for mid/high-rise units compared to a 2.8% rise in
approximately 51% of JBG’s share of annualized rent of its
Portfolio Composition by Asset Class Portfolio Composition by Location
Operating Construction / Pre-Development Total Operating Construction / Pre-Development Total
____________________ Note: Statistics exclude covered land assets.
2.6M Pro Rata SF
Office 46% Multifamily 50% Retail 4%
13.9M Pro Rata SF
Office 56% Multifamily 37% Retail 7%
11.3M Pro Rata SF
Inside the Beltway 67% Outside the Beltway- Metro 20% Outside the Beltway 13%
2.6M Pro Rata SF
Inside the Beltway 95% Outside the Beltway- Metro 3% Outside the Beltway 2%
13.9M Pro Rata SF
Inside the Beltway 72% Outside the Beltway- Metro 17% Outside the Beltway 11%
11.3M Pro Rata SF
Office 59% Multifamily 34% Retail 7%
31
Operating Assets - Overview
____________________ (1) JBG share of annualized adjusted historical NOI, before rent abatements. Excludes incidental income contributing $1.0M of JBG share of 1Q16 annualized adjusted historical NOI, before rent abatements.
Washington, DC 5600 Fishers Lane (GSA) Rockville, MD Atlantic Plumbing Washington, DC
32
16th & I Street Washington, DC
in Metro-served locations
entry markets in the United States
and maintain high occupancy levels through all market cycles, attract high-quality tenants and appeal to a broad range of buyers when offered for sale
Pro Rata NOI $211.5M Office 72% Multifamily 20% Retail 8%
(1)
Operating Assets - Data
____________________ Source: Exhibit 99.3 to the NYRT Current Report on Form 8-K, filed with the SEC on May 25, 2016, pages 42, 44 and 46. Note: Table shown at 100 percent share, except as noted pro rata. (1) Percent leased, percent occupied and rent per square feet metrics are calculated at 100 percent share. (2) Annualized adjusted historical asset-level NOI, before rent abatements. Excludes incidental income contributing $1.0M of JBG share of 1Q16 annualized adjusted historical asset-level NOI, before rent abatements.
33
Pro Rata 1Q 2016 1Q 2016 Pro Rata Pro Rata Annualized Annualized Annualized Annualized Number of Rentable Number of Percent Percent Rent Rent Per NOI NOI Assets Square Feet Units Leased Occupied ($000s) Square Foot ($000s) ($000s) Office Stabilized 27 4,889,362 96.8% 96.5% $280,627 $35.19 $163,650 $121,428 Embedded Growth Opportunities 9 1,696,264 80.2% 78.1% 10,646 38.99 37,851 30,476 Recently Acquired/Delivered/Renovated 2 109,564 75.0% 50.3% 7,653 42.94 4,615 456 Total Operating Office 38 6,695,190 92.2% 90.5% $298,926 $36.10 $206,115 $152,360 Multifamily Stabilized - Mid/High-Rise 4 171,225 211 93.7% 89.7% $26,738 $28.02 $20,942 $3,724 Stabilized - Garden-Style 11 3,211,961 3,705 95.7% 93.7% 64,201 19.35 40,812 37,256 Recently Acquired/Delivered/Renovated 4 445,677 585 48.4% 39.2% 9,539 24.24 2,719 2,220 Total Operating Multifamily 19 3,828,863 4,501 86.1% 82.4% $100,478 $19.87 $64,473 $43,200 Retail Stabilized 12 710,838 95.2% 91.7% $37,460 $29.22 $26,060 $13,852 Embedded Growth Opportunities 1 57,623 66.5% 55.6% 1,201 48.98 2,466 1,208 Recently Acquired/Delivered/Renovated 2 48,304 64.1% 61.2% 1,616 54.39 905 900 Total Operating Retail 15 816,766 91.9% 87.8% $40,276 $32.52 $29,431 $15,960 Total Stabilized 54 8,983,386 3,916 96.1% 94.6% $409,026 $29.53 $251,464 $176,260 Total Embedded Growth Opportunities 10 1,753,887
76.8% 11,846 39.53 40,316 31,684 Total Recently Acquired/Delivered/Renovated 8 603,545 585 55.6% 42.8% 18,808 30.00 8,239 3,576 Total/Weighted Average 72 11,340,819 4,501 90.1% 87.5% $439,680 $31.21 $300,019 $211,520
(2) (2) (1) (1) (1)
Operating Assets - Additional Growth Opportunities - Future Leases
____________________ Source: Exhibit 99.3 to the NYRT Current Report on Form 8-K, filed with the SEC on May 25, 2016, page 54. (1) Reflects our pro rata JBG share of Joint Venture assets. (2) Represents base rent before abatements, plus tenant reimbursements for the month in which the lease commences, multiplied by 12. Triple net leases are converted to a gross basis by adding tenant reimbursements to base rent.
34
estimated to commence by March 31, 2017
Office - Signed but not Commenced Leases
At 100 Percent Share At JBG Share(1) Office Asset Percent Ownership Estimated Lease Commencement Date Estimated Lease Expiration Date Rentable Square Feet Annualized Rent(2) Rentable Square Feet Annualized Rent(2) Stabilized L'Enfant Plaza Office - North 49.0% Oct-16 Sep-26 33,466 $1,476,682 16,396 $723,504 RTC - West 100.0% Aug-16 May-26 23,480 817,772 23,480 817,772 RTC - West 100.0% Aug-16 Jul-27 4,986 191,972 4,986 191,972 Artery Plaza 100.0% Jun-16 May-26 5,388 275,606 5,388 275,606 Artery Plaza 100.0% Apr-16 Sep-16 558 8,376 558 8,376 Chase Tower 10.0% Jul-16 Jun-24 4,989 193,374 499 19,337 6862 Elm Street 100.0% Jun-16 Oct-21 2,832 94,797 2,832 94,797 11333 Woodglen Drive 18.0% Apr-16 Dec-23 2,603 72,884 469 13,119 Rosslyn Gateway - North 18.0% Jun-16 Dec-21 834 32,882 150 5,919 Hungerford Plaza 100.0% Jun-16 May-18 262 6,104 262 6,104 Total 79,398 $3,170,449 55,020 $2,156,506 Recently Acquired/Delivered/Renovated 16th & I Street 71.9% Apr-16 Mar-31 87,226 $7,774,453 62,698 $5,588,265 Total 87,226 $7,774,453 62,698 $5,588,265 Total Operating 166,624 $10,944,902 117,718 $7,744,771 Construction CEB Tower at Central Place 100.0% Apr-18 Mar-33 348,847 $21,628,514 348,847 $21,628,514 Total 348,847 $21,628,514 348,847 $21,628,514 Total 515,471 $32,573,416 466,565 $29,373,285
Operating Assets - Additional Growth Opportunities - Future Leases (Cont ’d)
____________________ Source: Exhibit 99.3 to the NYRT Current Report on Form 8-K, filed with the SEC on May 25, 2016, page 65. (1) Reflects our pro rata JBG share of Joint Venture assets. (2) Represents base rent before abatements, plus tenant reimbursements for the month in which the lease commences, multiplied by 12. Triple net leases are converted to a gross basis by adding tenant reimbursements to base rent.
35
Retail - Signed but not Commenced Leases
At 100 Percent Share At JBG Share(1) Retail Asset Percent Ownership Estimated Lease Commencement Date Estimated Lease Expiration Date Rentable Square Feet Annualized Rent(2) Rentable Square Feet Annualized Rent(2) Stabilized Galvan Retail 1.8% May-16 May-26 10,000 $450,000 180 $8,100 Galvan Retail 1.8% Dec-16 Nov-26 2,523 186,954 45 3,365 Galvan Retail 1.8% Apr-16 Mar-26 2,195 180,758 40 3,254 Galvan Retail 1.8% Sep-16 Aug-26 2,000 156,200 36 2,812 Galvan Retail 1.8% Apr-16 Mar-26 1,672 113,387 30 2,041 Galvan Retail 1.8% Apr-16 Apr-26 1,560 109,356 28 1,968 Galvan Retail 1.8% Jun-16 Jun-26 1,505 99,480 27 1,791 Galvan Retail 1.8% Oct-16 Sep-21 1,560 72,972 28 1,313 Stonebridge at Potomac Town Center - Phase I 10.0% Aug-16 Jul-26 4,040 200,877 404 20,088 Stonebridge at Potomac Town Center - Phase I 10.0% Jun-16 May-26 2,269 120,983 227 12,098 Takoma-Langley Crossroads Center 99.0% Jun-16 Sep-28 5,488 192,080 5,432 190,159 Takoma-Langley Crossroads Center 99.0% Nov-16 Oct-34 2,111 128,800 2,090 127,512 Fort Totten Square Retail 99.4% Sep-16 Jan-27 3,870 154,800 3,846 153,824 Fort Totten Square Retail 99.4% Oct-16 Sep-26 2,257 125,399 2,243 124,608 L'Enfant Plaza Retail - West 49.0% Jul-16 Jun-26 1,967 135,736 964 66,504 L'Enfant Plaza Retail - West 49.0% Oct-16 Sep-26 2,002 70,070 981 34,331 L'Enfant Plaza Retail - West 49.0% Jan-17 Dec-26 8,888 44,440 4,355 21,773 North End Retail I 100.0% Jul-16 Jun-21 2,574 128,808 2,574 128,808 Old Centreville Crossing 99.0% May-16 May-26 1,200 58,200 1,188 57,618 The Terano 1.8% Jul-16 Nov-20 1,500 41,668 27 750 The Gale 5.0% Aug-16 Jul-23 1,200 36,000 60 1,800 Total 62,381 $2,806,968 24,805 $964,517 Recently Acquired/Delivered/Renovated Atlantic Plumbing 64.0% Jun-16 Jun-26 2,188 $142,264 1,400 $91,049 Atlantic Plumbing 64.0% Jul-16 Jun-26 1,977 98,850 1,265 63,264 Pikesville Walgreens 99.0% Jun-16 Dec-25 1,400 32,824 1,386 32,496 Total 5,565 $273,938 4,051 $186,809 Total Operating 67,946 $3,080,906 28,856 $1,151,326 Construction RTC - West Retail 100.0% Oct-17 Oct-27 9,673 $580,380 9,673 $580,380 RTC - West Retail 100.0% Jul-17 Jul-27 2,124 168,858 2,124 168,858 7770 Norfolk 79.9% Apr-17 Mar-27 3,020 222,081 2,414 177,506 7770 Norfolk 79.9% May-17 Apr-27 2,622 179,992 2,096 143,865 13th & U Street 100.0% Feb-17 Jan-42 8,438 147,759 8,438 147,759 Total 25,877 $1,299,070 24,745 $1,218,368 Pre-Development & Land Tysons West - Phase II 86.8% Sep-20 Sep-35 25,610 $1,603,430 22,222 $1,391,299 51 N Street 30.0% Nov-18 Oct-33 33,000 1,287,000 9,900 386,100 965 Florida Avenue 70.0% Jan-20 Jan-40 40,075 1,182,213 28,053 827,549 Upper Rock Retail 100.0% Jan-17 Mar-42 14,600 546,000 14,600 546,000 Upper Rock Retail 100.0% Jun-17 Jun-26 16,000 472,000 16,000 472,000 Total 129,285 $5,090,643 90,775 $3,622,948 Total 223,108 $9,470,619 144,378 $5,992,642
Operating Assets - Additional Growth Opportunities - Lease Up
RECENTLY ACQUIRED / DELIVERED / RENOVATED ASSETS AND EMBEDDED GROWTH ASSETS
36
retail assets ($17.1M on a pro rata basis)
____________________ Source: Exhibit 99.3 to the NYRT Current Report on Form 8-K, filed with the SEC on May 25, 2016, pages 17, 18 and 19. Note: Table shown at 100 percent share, except as noted pro rata. (1) Represents 10 year historical submarket average through March 31, 2016, except for 800 North Glebe, which is based on a competitive set of applicable Ballston, Rosslyn, and Clarendon office buildings and multifamily assets, which are based on competitive set leased percentage. (2) Represents the weighted average asking market rent per square foot as of March 31, 2016 based on a competitive set designated for each building by JLL except for retail assets, which are based on weighted average in-place rents. Triple net leases are converted to a gross basis by adding tenant reimbursements to base rent.
Pro Rata Pro Rata Renovation Pro Pro Rata Submarket Weighted Average Pro Rata Potential Potential 1Q 2016 1Q 2016 Percent Completion Rata Rentable Percent Percentage Comp Set Rent Per Estimated Cost Incremental Incremental Annualized Annualized Office Assets Submarket Ownership Date Units Square Feet Leased Leased Square Foot / Unit to Stabilize Annualized Rent Annualized Rent Adjusted NOI Adjusted NOI Recently Acquired/Delivered/Renovated The Foundry Georgetown 9.9% 2Q 2017 23,105 76.2% 89.8% $49.37 $205,262 $1,571,003 $155,218 $4,615 $456 16th & I Street CBD 71.9% 1Q 2016 86,459 72.5% 89.1% 77.83 1,238,542 1,550,698 1,114,639
109,564 75.0% 89.6% $60.32 $1,443,804 $3,121,701 $1,269,857 $4,615 $456 Embedded Growth Opportunities RTC - West Reston 100.0% 495,348 83.0% 90.9% $32.80 $2,389,419 $1,275,802 $1,275,802 $6,784 $6,784 L'Enfant Plaza Office - East Southwest 49.0% 214,577 88.1% 97.0% 43.53 1,277,197 1,706,093 835,905 12,785 6,264 800 North Glebe Road Ballston 100.0% 306,456 79.1% 85.9% 55.81 1,334,518 1,167,004 1,167,004 8,336 8,336 L'Enfant Plaza Office - North Southwest 49.0% 149,010 63.4% 97.0% 43.53 3,337,107 4,457,759 2,184,091 1,674 820 1233 20th Street CBD 100.0% 154,584 88.8% 92.6% 50.57 454,936 291,573 291,573 3,232 3,232 2121 Wisconsin Avenue Uptown 100.0% 110,241 88.2% 89.4% 41.81 87,660 56,133 56,133 2,152 2,152 6862 Elm Street McLean 100.0% 103,556 79.7% 94.1% 34.73 990,101 518,014 518,014 2,016 2,016 Reston Arboretum Reston 100.0% 95,666 81.8% 90.9% 32.80 533,835 285,029 285,029 324 324 Old Dominion McLean 100.0% 66,826 55.8% 94.1% 34.73 1,697,767 888,264 888,264 548 548 Total/Weighted Average Embedded Growth Opportunities 1,696,264 80.2% 92.7% $41.31 $12,102,539 $10,645,671 $7,501,814 $37,851 $30,476 Total/Weighted Average Office 1,805,828 79.5% 92.2% $44.49 $13,546,343 $13,767,372 $8,771,671 $42,466 $30,932 Multifamily Assets Recently Acquired/Delivered/Renovated Mid/High-Rise Galvan Rockville Pike Corridor 1.8% 4Q 2015 6 5,318 33.1% 94.3% $2,013
$94,601 ($222) ($4) Fort Totten Square Brookland/Fort Totten 99.4% 2Q 2015 343 252,688 62.3% 94.8% 1,917
2,563,862 2,218 2,204 Atlantic Plumbing U Street/Shaw 64.0% 4Q 2015 198 157,186 37.4% 94.4% 2,821
3,827,999 (175) (112) Notch 8 Potomac Yard 14.7% 4Q 2015 37 30,484 64.4% 96.0% 1,999
281,261 898 132 Total/Weighted Average Multifamily 585 445,677 48.4% 94.8% $2,236
$6,767,722 $2,719 $2,220 Retail Assets Recently Acquired/Delivered/Renovated Pikesville Walgreens Pikesville 99.0% 2Q 2015 25,221 78.0% 93.2% $40.31 $216,224 $156,006 $154,446 $525 $520 275 N. Washington Rockville Pike Corridor 100.0% 3Q 2015 23,083 48.7% 94.1% 79.29 1,162,825 830,590 830,590 380 380 Total/Weighted Average Recently Acquired/Delivered/Renovated 48,304 64.1% 93.6% $68.78 $1,379,050 $986,596 $985,036 $905 $900 Embedded Growth Opportunities L'Enfant Plaza Retail - West Southwest 49.0% 57,623 66.5% 97.1% $33.41 $823,502 $1,200,556 $588,216 $2,466 $1,208 Total/Weighted Average Embedded Growth Opportunities 57,623 66.5% 97.1% $33.41 $823,502 $1,200,556 $588,216 $2,466 $1,208 Total/Weighted Average Retail 105,928 65.8% 96.1% $43.50 $2,202,552 $2,187,152 $1,573,251 $3,371 $2,108 Total/Weighted Average 585 2,357,433 70.1% 93.1% $15,748,894 $31,684,854 $17,112,645 $48,555 $35,260
(2) (2) (1) (2) Construction Assets
____________________ (1) NOI at the midpoint of the targeted yield range.
CEB Tower at Center Place Arlington, VA Reston Heights Reston, VA 7770 Norfolk Bethesda, MD
37
1244 South Capitol Washington, DC
demand, while leasing up high value space closer to or after delivery, when the space can be physically shown to the market
with respect to each of these assets to mitigate potential cost overruns
(1)
Construction Assets - Data
38
____________________ Source: Exhibit 99.3 to the NYRT Current Report on Form 8-K, filed with the SEC on May 25, 2016, pages 20 and 21. Note: Table shown at 100 percent share, except as noted pro rata. (1) Based on JBG management's estimates as of March 31, 2016 and includes all acquisition costs, hard costs, soft costs, tenant improvements and leasing costs to develop and stabilize the asset. (2) Represents JBG management’s estimate of cost incurred to date, plus the estimated remaining cost to complete the asset as of March 31, 2016. JBG management’s estimate of cost incurred to date is based on the most recent transaction value, which may differ from JBG’s original acquisition basis. Schedule Office Assets Location Submarket Percent Ownership Pro Rata Estimated Rentable Square Feet Pro Rata Estimated Number
Percent Pre- leased Weighted Average Pre- lease Rent Per Square Foot Construction Start Date Estimated Completion Date Estimated Stabilization Date Estimated Remaining Cost to Complete ($000s) Estimated Total Cost ($000s) Targeted NOI Yield Range Stabilized NOI at Midpoint ($000s) Pro Rata Stabilized NOI at Midpoint ($000s) CEB Tower at Central Place Arlington, VA Rosslyn 100.0% 536,710 65.0% $62.00 4Q 2014 2Q 2018 4Q 2019 $219,719 $340,930 7.7% - 8.2% $26,978 $26,978 Total/Weighted Average Office 536,710 65.0% $62.00 $219,719 $340,930 7.7% - 8.2% $26,978 $26,978 Multifamily Assets Mid/High-Rise Reston Heights - Phase I Reston, VA Reston 10.0% 32,716 39 4Q 2015 2Q 2018 3Q 2019 $72,680 $94,037 8.1% - 8.6% $7,814 $781 1244 South Capitol Street Washington, DC Southeast 100.0% 226,283 291 4Q 2015 2Q 2018 3Q 2019 76,631 105,938 7.3% - 7.8% 8,049 8,049 7770 Norfolk Bethesda, MD Bethesda CBD 79.9% 166,793 160 3Q 2013 3Q 2016 3Q 2017 8,319 101,331 5.7% - 6.2% 6,019 4,811 13th & U Street Washington, DC U Street/Shaw 100.0% 147,056 130 1Q 2015 3Q 2017 2Q 2018 39,426 68,421 7.8% - 8.3% 5,527 5,527 Total/Weighted Average Multifamily 572,849 619 $197,056 $369,727 7.2% - 7.7% $27,410 $19,169 Retail Assets Reston Heights - Phase I Retail Reston, VA Reston 10.0% 8,969
2Q 2018 2Q 2019 $37,468 $43,352 4.7% - 5.2% $2,142 $214 RTC - West Retail Reston, VA Reston 100.0% 40,100 29.4% 63.51 4Q 2015 2Q 2017 1Q 2018 26,027 29,650 6.6% - 7.1% 2,044 2,044 4735 Bethesda Avenue Retail Bethesda, MD Bethesda CBD 100.0% 16,737
3Q 2016 3Q 2019 12,145 29,677 3.0% - 3.5% 953 953 Total/Weighted Average Retail 65,806 8.1% $63.51 $75,640 $102,679 4.8% - 5.3% $5,139 $3,211 Total/Weighted Average Construction 1,175,365 619 $492,415 $813,336 7.1% - 7.6% $59,527 $49,358
(1) (2) Pre-Development Assets
____________________ (1) NOI at the midpoint of the targeted yield range.
1900 N Street Washington, DC 50 Patterson Street Washington, DC West Half Washington, DC Atlantic Plumbing C Washington, DC
39
medium and long-term growth
a position to commence construction on all of these assets by the end of 2017
Served
(1)
Office 50% Multifamily 48% Retail 2%
Pro Rata NOI $66.5M
Pre-Development Assets - Data
40
____________________ Source: Exhibit 99.3 to the NYRT Current Report on Form 8-K, filed with the SEC on May 25, 2016, page 22. Note: Table shown at 100 percent share, except as noted pro rata. (1) Based on JBG management's estimates as of March 31, 2016 and includes all acquisition costs, hard costs, soft costs, tenant improvements and leasing costs to develop and stabilize the asset. (2) Represents JBG management’s estimate of cost incurred to date, plus the estimated remaining cost to complete the asset as of March 31, 2016. JBG management’s estimate of cost incurred to date is based on the most recent transaction value, which may differ from JBG’s original acquisition basis.
Schedule Office Assets Asset Type Location Submarket Percent Ownership Pro Rata Estimated Rentable Square Feet Percent Pre-leased Estimated Construction Start Date Estimated Completion Date Estimated Stabilization Date Estimated Remaining Cost to Complete ($000s) Estimated Total Cost ($000s) Targeted NOI Yield Range Stabilized NOI at Midpoint ($000s) Pro Rata Stabilized NOI at Midpoint ($000s) 1900 N Street Office Washington, DC CBD 100.0% 268,631
1Q 2020 3Q 2021 $136,272 $193,576 7.7% - 8.2% $15,452 $15,452 4747 Bethesda Avenue Office Bethesda, MD Bethesda CBD 100.0% 260,236
3Q 2019 1Q 2021 131,200 153,490 8.3% - 8.8% 13,142 13,142 1250 1st Street Office Washington, DC NoMa 30.0% 75,447
3Q 2020 1Q 2022 111,862 132,277 7.3% - 7.8% 9,969 2,991 50 Patterson Street Office Washington, DC NoMa 30.0% 50,205
2Q 2019 4Q 2019 63,660 75,819 7.8% - 8.3% 6,111 1,833 Total/Weighted Average Office 654,519
$555,162 7.8% - 8.3% $44,674 $33,418 Multifamily Assets Georgetown Development Parcel Multifamily Washington, DC Georgetown Multifamily 100.0% 204,892
3Q 2019 2Q 2020 $102,914 $104,855 8.8% - 9.3% $9,467 $9,467 West Half II Multifamily Washington, DC Southeast 94.2% 163,945
3Q 2019 1Q 2020 88,585 99,407 8.2% - 8.7% 8,397 7,914 West Half III Multifamily Washington, DC Southeast 94.2% 196,777
3Q 2019 2Q 2020 87,060 124,970 6.4% - 6.9% 8,299 7,822 Atlantic Plumbing C – North Multifamily Washington, DC U Street/Shaw 60.0% 86,926
2Q 2019 1Q 2020 60,520 75,084 7.5% - 8.0% 5,844 3,506 51 N Street Multifamily Washington, DC NoMa 30.0% 35,994 27% 1Q 2017 2Q 2019 4Q 2019 51,255 63,604 5.8% - 6.3% 3,849 1,155 Atlantic Plumbing C – South Multifamily Washington, DC U Street/Shaw 60.0% 47,806
2Q 2019 3Q 2019 34,750 43,525 7.2% - 7.7% 3,224 1,934 Total/Weighted Average Multifamily 736,339 3% $425,084 $511,445 7.4% - 7.9% $39,080 $31,798 Retail Assets Stonebridge at Potomac Town Center - Phase II Retail Woodbridge, VA Prince William County 10.0% 5,174
4Q 2018 3Q 2019 $30,646 $33,226 8.3% - 8.8% $2,831 $283 Upper Rock Retail Retail Rockville, MD North Rockville 100.0% 34,700 88% 3Q 2016 3Q 2017 1Q 2018 15,986 29,911 3.1% - 3.6% 1,017 1,017 Total/Weighted Average Retail 39,874 35% $46,632 $63,137 5.8% - 6.3% $3,848 $1,300 Total/Weighted Average Pre-Development 1,430,732 $914,710 $1,129,744 7.5% - 8.0% $87,601 $66,516
(1) (2) 41
Land Bank
Pro Rata Remaining Access Costs Pro Rata Estimated Potential Density (SF) Land Asset Location Submarket Percent Ownership Status Pro Rata Estimated Rentable Square Feet to be Redeveloped Pro Rata Estimated Units to be Redeveloped Share of Corresponding Adjusted Historical Asset- Level NOI ($000s) Remaining Acquisition Cost ($000s) Office Multifamily Retail Total Pro Rata Estimated Value as of March 31, 2016 ($000s) Fee Simple Mark Center Alexandria, VA I-395 Corridor 100% Owned 12,418 764 $6,644____________________ Source: Exhibit 99.3 to the NYRT Current Report on Form 8-K, filed with the SEC on May 25, 2016, pages 48 and 49. (1) Represents JBG management's estimate of the total office and/or retail square feet and multifamily units that would need to be redeveloped in order to access the estimated potential density. (2) Represents the annualized cash NOI of corresponding operating asset(s) that would need to be redeveloped in order to access the estimated potential density. Calculated as (i) for office and retail assets, square feet to be redeveloped divided by total
the three months ended March 31, 2016, multiplied by four. (3) Represents JBG management's estimate of remaining deposits, option payments and option strike prices. (4) Reflects JBG management’s estimate of developable square feet based on its current business plans as of March 31, 2016. JBG management’s estimates of potential densities are not, in all cases, the estimated maximum density, but rather are based on various factors, including market demand and current business plans. The estimated densities also are subject to final plan approvals by the relevant governmental authority in which the project is located. As a result of these densities being based on JBG management’s plans and final governmental approval, JBG management cannot provide any assurances that the outlined allowable densities will be achieved. JBG’s land bank includes 11 parcels attached to JBG’s existing operating assets that would require a redevelopment of approximately 532,000 office and/or retail square feet and 1,160 multifamily units in order to access approximately 7.2 million square feet of total estimated potential density. (5) Represents JBG management's estimate of value as of March 31, 2016. The value contemplates JBG management’s estimate of any entitlement costs, option payments, ground lease payments or other costs required to access the estimated potential
42
Debt Summary
____________________ Source: Exhibit 99.3 to the NYRT Current Report on Form 8-K, filed with the SEC on May 25, 2016, page 86. (1) LIBOR is assumed to be 0.43 percent for loans which are denoted as floating with cap or floating (no hedge). (2) In April 2016, we agree to terms with our lender to extend this loan for one year to April 29, 2017. All terms will remain unchanged with the exception of the interest rate which will be L + 3.00 percent. (3) In April 2016, we exercised an extension option to extend the loan to May 31, 2017. All other loan terms remained unchanged. (4) We have a signed term sheet with the existing lender to fund vertical construction of this project. The construction loan is expected to close in the June of 2016. The maximum loan amount will be $11.5 million, the interest rate will be LIBOR + 2.00 percent, the loan term will be two years. (5) RANs stands for Revenue Anticipation Notes.
JBG Property Level Debt as of 3/31/2016 Asset Additional Debt Description Principal Balance Pro Rata Share of Principal Balance Stated Interest Rate Interest Rate Hedge Current Annual Interest Rate(1) Maturity Date 4747 Bethesda Avenue(2) $12,500 $12,500 L + 2.40%
4/29/16 Leesburg Pike Retail(3) 9,990 9,890 3.13% Fixed 3.13% 5/30/16 Upper Rock Retail(4) 3,500 3,500 L + 3.75%
6/30/16 1600 K Street 21,135 21,135 4.93% Fixed 4.93% 7/1/16 One Choke Cherry 23,978 23,978 L + 3.00% Swap 3.70% 8/26/16 Reston Arboretum 13,012 13,012 L + 2.75%
9/1/16 2115 Wisconsin Avenue 28,908 28,908 5.30% Fixed 5.30% 10/1/16 2121 Wisconsin Avenue 13,342 13,342 5.30% Fixed 5.30% 10/1/16 Rosslyn Gateway - North, Rosslyn Gateway - South 44,700 8,046 L + 2.50%
11/8/16 5609 Fishers Lane 5,024 3,349 5.00% Fixed 5.00% 12/12/16 275 N. Washington 9,565 9,565 3.25% Fixed 3.25% 12/15/16 RTC - West 95,035 95,035 L + 2.35%
3/15/17 Capitol Point - North 10,996 1,856 L + 3.50% Swap 4.12% 3/30/17 Lynbrook 50,910 50,910 L + 2.50%
4/1/17 Meadowcreek 34,470 34,470 L + 2.50%
4/1/17 Hillwood 60,872 60,872 L + 2.50%
4/1/17 Brookdale 36,669 36,669 L + 2.50%
4/1/17 Stoneridge 21,401 21,401 L + 2.50%
4/1/17 The Shops At Mark Center(5) 9,498 9,498 L + 2.50%
4/1/17 5600 Fishers Lane - U.S. Government Tenant (GSA) RANs 30,900 20,600 2.03% Fixed 2.03% 4/5/17 Fort Totten Square, Fort Totten Square Retail 71,455 71,004 L + 2.15% Swap 4.23% 4/11/17 Hungerford Plaza 7,375 7,375 L + 3.00% Swap 4.12% 5/31/17 800 North Glebe Road 96,500 96,500 L + 2.25%
6/17/17 7770 Norfolk 49,262 39,374 L + 2.40% Swap 4.85% 7/16/17 North End Retail I 4,339 4,339 L + 2.25%
7/31/17 Jefferson Court 73,000 73,000 L + 2.25%
8/16/17 Atlantic Plumbing 86,905 55,619 L + 2.25% Swap 3.67% 9/9/17 5635 Fishers Lane 24,574 2,457 L + 4.75% Cap 5.18% 9/14/17 16th & I Street 60,673 43,612 L + 2.25% Swap 4.77% 9/28/17
43
Debt Summary (Cont ’d)
____________________ Source: Exhibit 99.3 to the NYRT Current Report on Form 8-K, filed with the SEC on May 25, 2016, page 86. (1) LIBOR is assumed to be 0.43 percent for loans which are denoted as floating with cap or floating (no hedge). (2) This loan is collateralized by a portion of the 1900 N Street land assemblage referred to as 1253 20th Street. The remaining portion of the property is encumbered by a separate loan. (3) Charter Oak is comprised of two parcels. This loan is collateralized by one parcel, a separate loan is collateralized by the remainder of the site. This loan has an interest rate floor of 4.00 percent. (4) The base rate for the loan is 3 month LIBOR, which was 0.63 percent as of March 31, 2016. (5) This loan is collateralized by a portion of the 1900 N Street land assemblage referred to as 1920 N Street. The remaining portion of the property is encumbered by a separate loan.
JBG Property Level Debt as of 3/31/2016 Asset Additional Debt Description Principal Balance Pro Rata Share of Principal Balance Stated Interest Rate Interest Rate Hedge Current Annual Interest Rate(1) Maturity Date The Terano $37,798 $680 L + 2.10% Cap 2.53% 11/8/17 Galvan 72,895 1,312 L + 2.70% Cap 3.13% 12/12/17 Notch 8, Notch 8 Retail 68,433 10,060 L + 1.95% Swap 3.53% 12/23/17 1900 N Street(2) 1,510 1,510 4.00% Fixed 4.00% 1/23/18 The Alaire 38,269 6,888 L + 2.10% Cap 2.53% 3/13/18 Charter Oak(3) 11,000 11,000 L + 3.50% Cap 4.00% 6/1/18 L'Enfant Plaza Office - North & East, Retail - East& West(4) 205,273 100,574 L + 3.65% Cap 4.28% 10/1/18 CEB Tower at Central Place 16,424 16,424 L + 2.45% Swap 3.18% 11/7/18 Artery Plaza Senior 83,130 83,130 L + 1.75% Cap 2.18% 12/23/18 Artery Plaza Mezzanine 15,000 15,000 L + 7.54% Cap 7.97% 12/23/18 5640 Fishers Lane 10,218 1,022 5.83% Fixed 5.83% 1/15/19 13th & U Street 3,267 3,267 L + 2.10% Swap 4.30% 3/16/19 1900 N Street(5) 28,270 28,270 L + 2.50% Swap 4.07% 5/8/19 1233 20th Street 44,206 44,206 4.38% Fixed 4.38% 11/1/19 The Foundry 44,224 4,369 L + 1.85% Cap 2.28% 12/12/19 11333 Woodglen Drive 14,000 2,520 L + 1.90% Swap 2.63% 1/1/20 6862 Elm Street 22,546 22,546 L + 1.80% Swap 3.33% 4/30/20 Old Dominion 12,091 12,091 L + 2.00% Swap 3.72% 6/19/20 Summit I, Summit II 59,000 59,000 L + 1.90% Cap 2.33% 8/4/20 Chase Tower 96,220 9,622 L + 1.65%
9/30/20 Stonebridge at Potomac Town Center - Phase I 94,000 9,400 L + 1.70% Swap 3.25% 12/10/20 Takoma-Langley Crossroads Center, Vienna Walgreens, Pikesville Walgreens 48,375 47,891 5.04% Fixed 5.04% 1/6/21 DOT - U.S. Government Tenant (GSA) A-1 Note 326,000 326,000 6.00% Fixed 6.00% 12/2/21 DOT - U.S. Government Tenant (GSA) A-2 Note 98,815 98,815 5.27% Fixed 5.27% 12/2/21 Fairway Apartments 38,500 3,850 L + 1.60% Swap 3.70% 7/1/22 Kennedy Row 30,480 27,432 L + 1.65% Swap 3.64% 7/1/22 12735 Twinbrook Parkway 18,265 1,827 7.19% Fixed 7.19% 7/15/22 The Gale 109,645 5,482 L + 1.60% Swap 3.56% 7/31/22 Falkland Chase - South & West 43,580 43,580 3.78% Fixed 3.78% 6/1/23
44
Debt Summary (Cont ’d)
____________________ Source: Exhibit 99.3 to the NYRT Current Report on Form 8-K, filed with the SEC on May 25, 2016, page 86. (1) LIBOR is assumed to be 0.43 percent for loans which are denoted as floating with cap or floating (no hedge). (2) Charter Oak is comprised of two parcels. This loan is collateralized by one parcel, a separate loan is collateralized by the remainder of the site. (3) In March 2016, we signed a term sheet with a lender to fund vertical construction of this project. The maximum loan amount will be $95.6 million, the interest rate will be LIBOR + 2.00 percent, the loan term will be four years.
JBG Property Level Debt as of 3/31/2016 Asset Additional Debt Description Principal Balance Pro Rata Share of Principal Balance Stated Interest Rate Interest Rate Hedge Current Annual Interest Rate(1) Maturity Date Falkland Chase - North $23,299 $23,299 L + 2.32% Cap 2.75% 6/1/23 Bennington Crossings 43,009 43,009 3.65% Fixed 3.65% 6/1/23 Charter Oak(2) 30,040 30,040 4.06% Fixed 4.06% 6/1/23 NCI - U.S. Government Tenant (GSA) A Note 52,065 52,065 3.90% Fixed 3.90% 7/15/23 5625 Fishers Lane 43,159 4,316 7.21% Fixed 7.21% 1/15/24 Fairmont Gardens 45,440 45,440 4.14% Fixed 4.14% 7/1/24 La Plata Shopping Center 9,825 9,727 4.12% Fixed 4.12% 2/1/25 Pickett Industrial Park 23,600 2,360 L + 1.45% Swap 3.56% 9/4/25 5601 Fishers Lane - U.S. Government Tenant (GSA) A Note 59,815 39,877 4.46% Fixed 4.46% 4/15/29 5601 Fishers Lane - U.S. Government Tenant (GSA) B Note 69,000 46,000 5.68% Fixed 5.68% 4/15/29 5600 Fishers Lane - U.S. Government Tenant (GSA) A Note 135,650 90,434 3.67% Fixed 3.67% 8/5/30 NCI - U.S. Government Tenant (GSA) B Note 112,240 112,240 6.10% Fixed 6.10% 7/15/33 5600 Fishers Lane - U.S. Government Tenant (GSA) B Note 172,660 115,107 5.48% Fixed 5.48% 8/5/40 Reston Heights - Phase I(3)
$3,521,724 $2,483,498