Satellite observations of NO 2 and methane over U.S. oil and gas - - PDF document

satellite observations of no 2 and methane over u s oil
SMART_READER_LITE
LIVE PREVIEW

Satellite observations of NO 2 and methane over U.S. oil and gas - - PDF document

7/6/2020 Satellite observations of NO 2 and methane over U.S. oil and gas production areas Barbara Dix 1 , Joep de Bruin 1,2 , Esther Roosenbrand 1,2 , Tim Vlemmix 3 , Colby Francoeur 1,4 , Alan Gorchov-Negron 5 , Brian McDonald 1,4 , Mikhail


slide-1
SLIDE 1

7/6/2020 1

Barbara Dix1, Joep de Bruin1,2, Esther Roosenbrand1,2, Tim Vlemmix3, Colby Francoeur1,4, Alan Gorchov-Negron5, Brian McDonald1,4, Mikhail Zhizhin1,4,6, Christopher Elvidge6, Pepijn Veefkind2,3, Pieternel Levelt2,3, Joost de Gouw1

Acknowledgements: Ronald van der A, Henk Eskes, Bud Pope NASA ACMAP program, Colorado Energy Research Collaboratory NOAA Cooperative Institute Agreement, Rocky Mountain Institute

1. Motivation and background 2. Satellite data used in this work 3. Emissions: observation and source attribution 4. Methane monitoring metrics 5. Summary and outlook

Satellite observations of NO2 and methane

  • ver U.S. oil and gas production areas

1University of Colorado 2University of Delft, the Netherlands 3KNMI, the Netherlands 4NOAA 5University of Michigan 6Colorado School of Mines

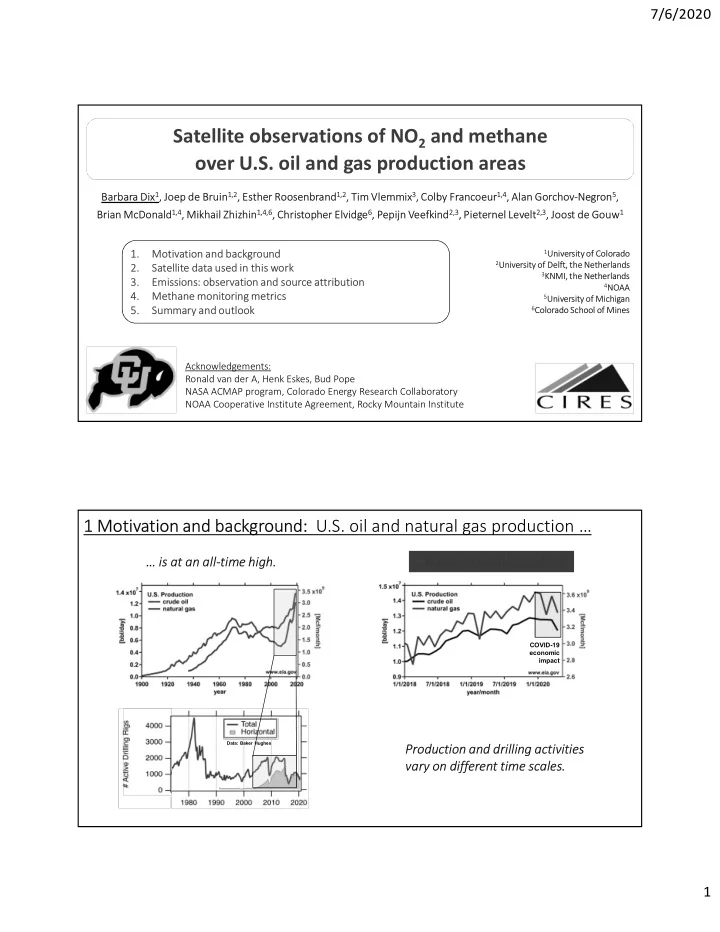
1 Motivation and background: U.S. oil and natural gas production …

… is at an all-time high.

Data: Baker Hughes

Production and drilling activities vary on different time scales. … is was at an all-time high.

COVID-19 economic impact

slide-2
SLIDE 2

7/6/2020 2

1 Motivation and background: U.S. oil and natural gas production

https://www.washingtonpost.com/graphics/national/united-states-of-oil/

2019: U.S. is the largest oil producer worldwide.

consumerenergyalliance.org

NOx CH4

What are the atmospheric impacts of oil and gas production?

VOCs

1 Motivation and background: Atmospheric impacts

  • NOx:

nitrogen oxide = NO (nitric oxide) + NO2 (nitrogen dioxide) Source: combustion  on-site motors/transportation Impacts: toxic (NO2), air pollution  ozone/particle formation Lifetime: ~ hours

  • VOCs:

Volatile Organic Compounds/hydrocarbons Sources: oil/gas/fracking chemicals Impacts: harmful to toxic, air pollution  ozone/particle formation Lifetime: ~ hours - days

  • CH4:

methane Sources: infrastructure leaks, venting, flaring Impact: greenhouse gas (warming potential ~ 25 times CO2) Lifetime: ~ 9 years

NOx  Air quality CH4  Climate

slide-3
SLIDE 3

7/6/2020 3

  • EPA sites with NO2 and O3 sensors

1 Motivation and background: NOx

4 3

several

(but mostly in Dallas)

Surface air quality monitoring in O&G production regions is very limited.

3 1

1 Motivation and background: Methane

Why are levels of methane rising globally?

www.eurekalert.orgmultimediapub128882.php

What is the contribution of O&G system emissions?

slide-4
SLIDE 4

7/6/2020 4

1 Motivation and background: Methane in the U.S.

www.epa.gov

*

* Some studies suggest EPA emissions are underestimated

72% of O&G system methane emissions come from production. Ozone Monitoring Instrument (OMI) NASA AURA satellite July 2004 - present Tropospheric Monitoring Instrument (TROPOMI) ESA Sentinel 5P satellite October 2017 - present Resolution: 24 x 13 km2 UV-vis channel: NO2, HCHO Global coverage: 1 day Resolution: 7 x 3.5/7 km2 UV-vis + SWIR channel: NO2, HCHO, CH4 Global coverage: 1 day

2 Satellite data used in this work

slide-5
SLIDE 5

7/6/2020 5

SUN NADIR MEASUREMENTS SATELLITE backscattered Solar Radiation EARTH

2 Satellite data used in this work

How does a remote sensing satellite work? Satellite observations of emissions are affected by surface reflectance and clouds.

Column density measurement in units of:

  • molecules per cm2 or
  • volume mixing ratio, e.g., ppb (parts per billion)

Surface Top of Atmosphere CH4 CH4 CH4 NO2 NO2 NO2 CH4 NO2 air air air air air air air air air NO2 CH4 CH4 Surface Top of Atmosphere CH4 CH4 CH4 NO2 NO2 air air air air air CH4 NO2 NO2 CH4 air air air air CH4 CH4 CH4 NO2 CH4 CH4 air air

Total column density = Emission + Background + Atmospheric chemistry + Atmospheric transport

NO2 NO2 + OH  HNO3

2 Satellite data used in this work

What does a remote sensing measurement mean?

Satellite measurements of emissions are affected by background concentrations and atmospheric chemistry and transport.

slide-6
SLIDE 6

7/6/2020 6

2 Satellite data used in this work

2018

OMI NO2

NO2 and CH4 over O&G production areas can be observed from space.

2018/05- 2020/04

TROPOMI NO2 TROPOMI CH4

2018/05- 2020/04 QA4ECV version 1.1; www.temis.nl Level 2, offline; https://scihub.copernicus.eu/ Level 2, offline; https://scihub.copernicus.eu/

2016: 2017: 2018:

Dix et al., GRL, 2020

3 Emissions: NOx source attribution

Bakken Denver- Julesberg San Juan Permian Eagle Ford

NO2 serves as proxy for NOx emissions.

slide-7
SLIDE 7

7/6/2020 7

NO2 = c1 ∙ background + c2 ∙ rig count + c3 ∙ oil volume

NOx emissions from production and drilling can be attributed separately. NOx emissions are dominated by those from drilling of new wells.

NO2 signal caused by: NOx fraction from production NOx fraction from drilling NOx background

Permian Basin

3 Emissions: NOx source attribution by multivariate regression

Dix et al., GRL, 2020 Dix et al., GRL, 2020; Francoeur et al., in prep., 2020 Gorchov Negron et al., Environ. Sci. Technol., 2018

Top-down (satellite) and bottom-up (inventory) source attributions agree. Dominant but declining fraction of NOx emissions come from drilling.

3 Emissions: NOx source attribution comparison with inventory

Permian Basin Bakken

Comparison with Fuel based Oil and Gas NOx inventory (FOG)

slide-8
SLIDE 8

7/6/2020 8

Dix et al., GRL, 2020

NOx from flaring contributes ~5-10% to total O&G NOx emissions.

(NOx from flaring is not (yet) discernable from space.)

Flaring volumes derived from VIIRS satellite night-time images

Elvidge et al., Energies, 2015

3 Emissions: NOx from flaring

NO2 scales with oil and gas production volumes.

TROPOMI NO2 Feb 2019 Feb 2019 Feb 2019

Esther Roosenbrand, CU Boulder, University of Delft, the Netherlands, master thesis, 2020 Industrial activity data from Enverus (formerly known as DrillingInfo)

3 Emissions: NOx source attribution by spatial correlation

slide-9
SLIDE 9

7/6/2020 9

TROPOMI CH4 Feb 2019 Feb 2019 Feb 2019

CH4 scales with oil and gas production volumes.

3 Emissions: CH4 source attribution by spatial correlation

de Gouw et al., Scientific Reports, 2020 Industrial activity data from Enverus (formerly known as DrillingInfo)

3 Emissions: CH4 source attribution by seasonal signal

Surface CH4 emissions are “trapped” in temperature inversion during winter.

2018/12- 2019/08

Uintah basin

TROPOMI CH4 2018/12 - 2019/03 TROPOMI CH4 2018/05 - 2020/04

de Gouw et al., Scientific Reports, 2020

slide-10
SLIDE 10

7/6/2020 10

Satellite column measurements are consistent with surface monitoring (Univ. of Utah).

Emissions: CH4 source attribution by seasonal signal

de Gouw et al., Scientific Reports, 2020

3 Emissions: CH4 and NO2 over the Denver-Julesberg and San Juan basins

CH4 NO2 gas

  • il

gas

  • il

2018/05 - 2019/12 Denver-Julesberg San Juan

CH4 NO2

TROPOMI NO2 spatial distributions are dominated by urban sprawl. TROPOMI CH4 spatial distributions show some correlation with O&G production areas.

Industrial activity data from Enverus (formerly known as DrillingInfo)

slide-11
SLIDE 11

7/6/2020 11

3 Emissions: CH4 over the Denver-Julesberg basin: current work

Fort Collins Boulder Denver DIA Greely

*CH4 = CH4 – background CH4 background CH4 = monthly 10th percentile  more sensitive to boundary layer excess CH4

  • ngoing cooperation with CDPHE

 3 research flights in summer 2020 Denver-Julesberg 2018/05 - 2020/04

CH4*

Research flights will help to link TROPOMI CH4 observations to local O&G emissions.

suggested flight tracks

4 CH4 monitoring metrics: trends in CH4 and CH4 vs production slopes

Note: 10 ppb  0.5% of total column

How can we monitor the industry’s performance?

Slope = CH4 / prod. unit

Currently: average CH4 emissions per oil and gas production ~ constant Reduction in CH4 emissions:  slope will decrease

slide-12
SLIDE 12

7/6/2020 12

2019/01/31

4 CH4 monitoring metrics: trends in CH4 – NO2 ratios

Currently: average NO2 /CH4 ratios ~ constant Reduction in CH4 emissions:  ratio will increase

Slope = NO2 /CH4 de Gouw et al., Scientific Reports, 2020

Distributions are determined by emissions and wind.  Upset emissions are captured in 90th percentile.

emissions wind

4 CH4 monitoring metrics: detection of upset emissions by pixel statistics

slide-13
SLIDE 13

7/6/2020 13

4 CH4 monitoring metrics: detection of single events

2019/02/26 2019/02 2019/03 2019/03/17

Single day (multi-day?) events get “lost” in monthly averages.

4 CH4 monitoring metrics: discussion on emissions

Benefit of natural gas over coal remains only if leakage is below break-even point.  How do we define break-even point?

Natural gas as bridge fuel for a carbon-free future?

Permian: 2.7 ± 0.5 Mt/a

break-even point based on gas system TROPOMI CH4 inversion Zhang et al., Science Advances, 2020 (CH4 emissions from atmospheric modeling) Schneising et al., ACPD, 2020 (CH4 emissions from mass balance) break-even point based on oil and gas system

Permian: 3.16 ± 1.13 Mt/a de Gouw et al., Earth’s Future, 2014

slide-14
SLIDE 14

7/6/2020 14

Summary

  • NOx from production and drilling can be attributed separately using NO2 time
  • series. Top-down and bottom-up source attributions agree on distribution

and trend.

  • Increased columns of NO2 and CH4 consistently correlate with oil and gas
  • production. Developed metrics can identify basin-wide trends and local
  • utliers.
  • Daily global coverage is suitable to observe intermittent industrial activity.
  • Satellite data can help assess effectiveness of NOx and CH4 regulations.

Outlook

  • Continued work on metrics development.
  • Quantifying basin-wide NO2 and CH4 emissions and pushing sub-basin scales.

5 Summary and outlook