Sconset Geotextile Tube Update Sconset Bluff, Nantucket Maria - - PowerPoint PPT Presentation

sconset geotextile tube update sconset bluff nantucket
SMART_READER_LITE
LIVE PREVIEW

Sconset Geotextile Tube Update Sconset Bluff, Nantucket Maria - - PowerPoint PPT Presentation

Sconset Geotextile Tube Update Sconset Bluff, Nantucket Maria Hartnett, Associate www.epsilonassociates.com Presentation Outline Project Setting & Need for Erosion Control Project Components Geotubes Sand Mitigation


slide-1
SLIDE 1

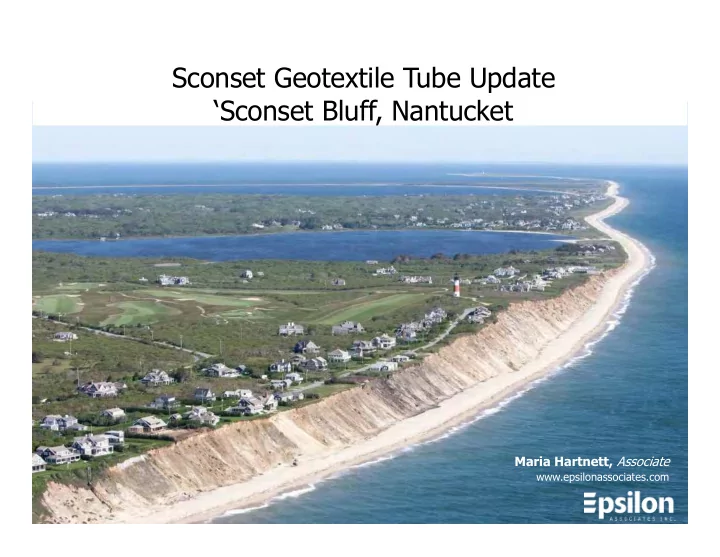
Sconset Geotextile Tube Update ‘Sconset Bluff, Nantucket

Maria Hartnett, Associate

www.epsilonassociates.com

slide-2
SLIDE 2

Presentation Outline

  • Project Setting & Need for Erosion Control
  • Project Components
  • Geotubes
  • Sand Mitigation
  • Vegetation
  • Stormwater Management
  • Monitoring Program
  • Conclusions & Next Steps
slide-3
SLIDE 3

Project Location

Project Location

  • Project site exposed to full

fetch of the Atlantic Ocean

  • Project site particularly

vulnerable to nor’easters

slide-4
SLIDE 4

Sconset Bluff

  • 70-90 feet tall
  • Glacial origin
  • Denuded (prior to 2015)
  • Narrow fronting beach
  • Vulnerable to wave attack
slide-5
SLIDE 5

Sconset Bluff and Storm Waves

slide-6
SLIDE 6

Community Setting

  • Area known as Siasconset

(Sconset)

  • Many historic homes built in

late 1800’s and early 1900’s

  • Served by a single

accessway known as Baxter Road

  • Sankaty Light
slide-7
SLIDE 7

Erosion History

  • Sconset Bluff began eroding

in the 1970’s

  • Erosion is progressing from

north to south

  • Group of residents formed

Sconset Beach Preservation Fund (SBPF)

slide-8
SLIDE 8

8

Coastal Bank Retreat

  • Long-Term Average:

4.6 feet/year

  • Potential Single Season Loss:

20-30+ feet/year

  • Winter 2012-2013 resulted in

catastrophic erosion

slide-9
SLIDE 9

Existing Conditions (June 2013)

109-91 Baxter Road

Baxter Road

  • Baxter Road, homes, and associated utilities (water/sewer) in imminent danger
  • Geotechnical engineer advised closure of road when within 25 feet of bluff edge
  • Town of Nantucket has legal obligation to provide access to homes
  • Town of Nantucket and SBPF entered partnership to sponsor erosion control project
slide-10
SLIDE 10

10

  • Managed retreat (house

moves)

  • Beach dewatering (installed in

2000 – inconsistent results)

  • Beach nourishment (applied

2006-2007 – not approved)

  • Marine mattresses and

gabions (applied 2010 – not approved)

  • Biodegradable bags or

envelopes (utilized since mid- 2000’s – useful in smaller storms but not effective in major or successive storms)

Many alternatives evaluated in theory and in practice since the 1990’s:

Alternatives

slide-11
SLIDE 11

Geotextile Tube Project

  • Preferred due to ability to withstand storm waves, sloped design (decreases wave reflection),

ease of installation and, if necessary, removal.

  • Fabricated from high strength, woven polypropylene sewn into a tube shape.
  • Three-four rows of 45’ circumference geotextile tubes, each about 19’ wide, 7’ tall, and 100-200’

long.

  • Two phases of construction: three tiers installed in December 2013/January 2014; fourth tier and

returns installed October through December 2015. Total length 947 feet.

slide-12
SLIDE 12

Construction of Geotextile Tube Project – December 2013/January 2014

slide-13
SLIDE 13
slide-14
SLIDE 14
slide-15
SLIDE 15
slide-16
SLIDE 16
slide-17
SLIDE 17

Construction of 4th Tier Geotextile Tube Project – Fall 2015

slide-18
SLIDE 18

Construction of 4th Tier Geotextile Tube Project

slide-19
SLIDE 19

Construction of 4th Tier Geotextile Tube Project

slide-20
SLIDE 20

Construction of 4th Tier Geotextile Tube Project

slide-21
SLIDE 21

Construction of 4th Tier Geotextile Tube Project

slide-22
SLIDE 22

Sand Mitigation

May 2015 August 2015

June 2016

  • Protection of bluff prevents it from serving as a sediment source and requires

mitigation

  • Massachusetts typically requires annual mitigation equivalent to average annual

contribution

  • Project provides 22 cy/lf/yr, which is equal to 1.5 times average annual bank

contribution

  • Total volume ~20,000 cy sand/yr
slide-23
SLIDE 23

Sand Delivery

  • Sand brought

to the site by dump truck from on-island pits

  • Sand delivery
  • ccurs during
  • ff-season

months only

slide-24
SLIDE 24

Sand Delivery

slide-25
SLIDE 25

How Geotextile Tubes Work

  • 1. Wave runup during storms hits the base of

the geotubes instead of the base of the bluff.

  • 2. The sand cover on the geotubes is washed

away, contributing sand like the natural bluff would.

  • 3. The sand template on the geotubes

is regraded so the tubes are covered.

slide-26
SLIDE 26
  • Once the base of the bluff was protected by

the geotextile tubes, the face of the bluff could also be stabilized by adding vegetation.

  • Vegetation helps to prevent erosion from

wind, rain, and stormwater runoff.

  • American Beachgrass planted in spring 2015;

additional planting occurred in spring 2016 above the new returns.

Vegetation

slide-27
SLIDE 27

Stormwater Drainage System

June 2016

  • Top and face of bluff can erode from wind, rain, and stormwater runoff.
  • In January and February 2016, a drainage system was installed on

Baxter Road. This drainage system serves to capture stormwater runoff and redirect it, so that it no longer causes erosion from the top

  • f the bluff.
  • Berm installed along roadway where needed to redirect stormwater

runoff away from the face of the bluff.

slide-28
SLIDE 28

Monitoring

Project is extensively monitored, including:

  • Annual Sand

Delivery Report

  • Annual Bluff Monitoring
  • Quarterly Shoreline Monitoring • Wetland Well Monitoring
  • Annual Beach

Invertebrate Monitoring

  • Semi-annual Underwater

Video Monitoring

  • Annual Drainage

System Report

slide-29
SLIDE 29

Monitoring - Key Findings

  • Geotube system in place since Jan 2014 – nearly 3.5 years/4 winters
  • Base of bluff has been stabilized by the geotextile tubes.
  • Shoreline monitoring data shows shoreline is within range of expected positions

based on historic data, with no indication of accelerated erosion in front of or adjacent to the geotubes.

  • 2016 bluff survey indicates that mitigation sand template is contributing more than

the historic contribution rate and the unprotected bluff.

  • No indication of adverse effect noted in beach invertebrate monitoring, wetland

well monitoring, or underwater video monitoring.

June 2016

May 2017

slide-30
SLIDE 30
  • The first annual aerial survey was

performed of the Project area on April 2,

  • 2016. Second annual survey just

completed late May 2017.

  • The results of the 2016 aerial survey

were compared to the 2013 aerial survey for those unprotected areas immediately adjacent to the geotextile tube project.

  • Unprotected bluff contribution volume

was 12.9 cy/lf/yr, which is 59% of mitigation volume.

Bluff Volume Loss in Unprotected Areas Adjacent to Geotextile Tubes Line Area Volume Lost (CY) Length (Feet) Duration (Years) Erosion Rate (CY/LF/YR) 1 North Unprotected Area 31,329 800 2.75 14.2 2 South Unprotected Area 4,370 210 2.75 7.6 3 Total Bluff Erosion for Adjacent Unprotected Areas 35,699 1,010 2.75 12.9

To the North: 800 ft unprotected bluff

Annual Aerial Survey of Bluff

slide-31
SLIDE 31

Summary

Geotube Area (2013-2016):

  • At least 22 cy/lf/yr sand delivered
  • 18.1 cy/lf/yr contributed
  • 14.8 cy/lf in template as of April 2016

Unprotected Bluff Areas (2013-2016):

  • 12.9 cy/lf/yr contributed
slide-32
SLIDE 32

Shoreline Monitoring

  • Shoreline monitoring at 46 transects

along 6 miles of shoreline conducted quarterly

  • Shoreline monitoring measures:
  • Change in position of the shoreline

(MLW line) and

  • Change in volume
  • Bathymetry (-5 MLW out to 3,000 feet
  • ffshore or -35 MLW isobath) conducted

in the spring and fall

  • >20 years of historical data
  • No indication of any adverse effect from

the geotextile tubes.

slide-33
SLIDE 33

Underwater Video Monitoring

  • Underwater video monitoring at 10 transects immediately seaward of

geotextile tubes and adjacent areas

slide-34
SLIDE 34

Underwater Video Monitoring – October 2016

June October

Biota: June and October identified invertebrate species, fish species, and marine plant and algal species, with some seasonal variability (spider crabs bury into sediments; black sea bass, scup, and skates move offshore). Branching brown and red algae, bread crumb sponge, and rock crab were dominant biota. No indication of adverse effect on marine biota.

  • 5. Sand Waves or Ripples 95%,

Pebbles 5%). TR-400

  • 9. (Flat Sand 30%, Pebble 5%, Cobble

30%, Boulder 35%). TR-710.

  • 12. (Pebble 100%). TR-1020.
  • 14. (Flat Sand 15%, Pebble 50%,

Cobble 35%). TR-1265.

  • 21. (Flat Sand 30%, Pebble

50%, Cobble 20%). TR-1925.

  • 16. (Flat Sand 45%, Pebble 15%,

Cobble 10%, Boulder 30%). TR-1500.

slide-35
SLIDE 35

Underwater Video Monitoring

Monitoring shows continued prevalence of cobble/bottom habitat located directly

  • ffshore of the geotextile tube Project, with no indication that cobble/boulder habitat is

being covered by the mitigation sand.

slide-36
SLIDE 36

Monitoring Conclusions

  • Geotextile tubes have stabilized the base of the bluff.
  • Mitigation sand from the project has contributed more sand than the historic

erosion rate and the recent contribution from the unprotected bluff.

  • Shoreline monitoring data shows no indication of accelerated erosion within
  • r directly adjacent to geotextile tubes.
  • No evidence of harm observed in wetland well monitoring, beach

invertebrate monitoring, and underwater video monitoring.

slide-37
SLIDE 37
  • Expand current system to 3400 ft
  • Review sand source options
  • Review monitoring program to focus on collecting most useful data
  • Review mitigation program to consider more adaptive approach

Next Steps

May 2017

slide-38
SLIDE 38

Questions?

Photo credits: George Riethof and the Sconset Trust, Rick Blair, Rob Benchley

Maria Hartnett, Associate

www.epsilonassociates.com

2014