
Bioinformatics Algorithms
(Fundamental Algorithms, module 2)
Zsuzsanna Lipt´ ak
Masters in Medical Bioinformatics academic year 2018/19, II. semester
Fragment Assembly with de Bruijn Graphs1
1These slides mainly based on Compeau, Pevzner, Tesler: How to apply de Bruijn
graphs to genome assembly, Nature Biotechnology 29 (11).
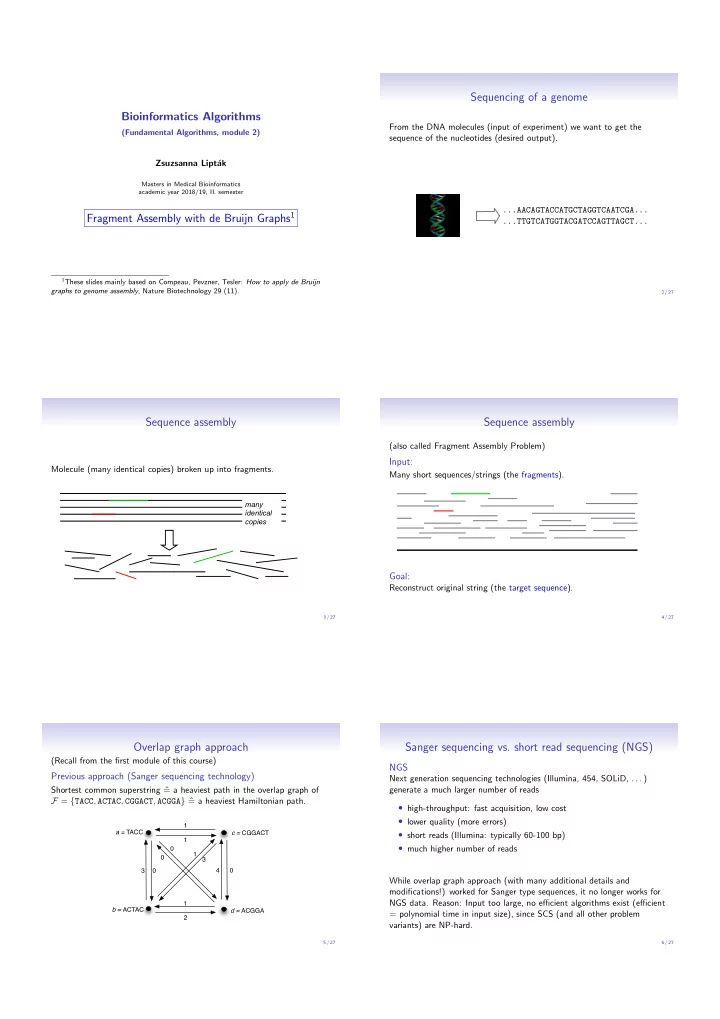
Sequencing of a genome
From the DNA molecules (input of experiment) we want to get the sequence of the nucleotides (desired output). ...AACAGTACCATGCTAGGTCAATCGA... ...TTGTCATGGTACGATCCAGTTAGCT...
2 / 27
Sequence assembly
Molecule (many identical copies) broken up into fragments.
many identical copies
3 / 27
Sequence assembly
(also called Fragment Assembly Problem)
Input:
Many short sequences/strings (the fragments).
Goal:
Reconstruct original string (the target sequence).
4 / 27
Overlap graph approach
(Recall from the first module of this course)
Previous approach (Sanger sequencing technology)
Shortest common superstring ˆ = a heaviest path in the overlap graph of F = {TACC, ACTAC, CGGACT, ACGGA} ˆ = a heaviest Hamiltonian path.
a = TACC b = ACTAC c = CGGACT d = ACGGA 1 1 1 3 3 4 1 2
5 / 27
Sanger sequencing vs. short read sequencing (NGS)
NGS
Next generation sequencing technologies (Illumina, 454, SOLiD, . . . ) generate a much larger number of reads
- high-throughput: fast acquisition, low cost
- lower quality (more errors)
- short reads (Illumina: typically 60-100 bp)
- much higher number of reads
While overlap graph approach (with many additional details and modifications!) worked for Sanger type sequences, it no longer works for NGS data. Reason: Input too large, no efficient algorithms exist (efficient = polynomial time in input size), since SCS (and all other problem variants) are NP-hard.
6 / 27