
SLIDE 1
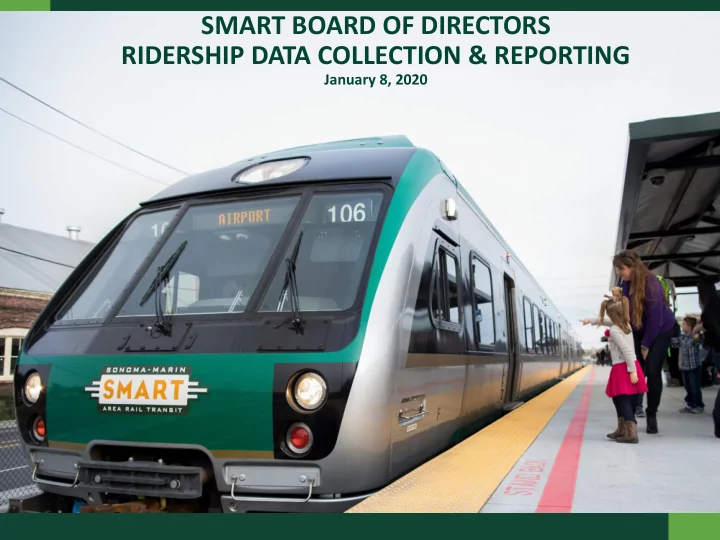
SMART BOARD OF DIRECTORS RIDERSHIP DATA COLLECTION & REPORTING
January 8, 2020
SMART BOARD OF DIRECTORS RIDERSHIP DATA COLLECTION & REPORTING - - PowerPoint PPT Presentation
SMART BOARD OF DIRECTORS RIDERSHIP DATA COLLECTION & REPORTING January 8, 2020 SMART Riders: More than 1.7 million strong Plus: Over 165,000 bikes Over 6,000 wheelchairs 2 Serving Marin and Sonoma County Residents We are proud
January 8, 2020
2
3
4
*Standard public transit agency practice to use Fiscal Year for reporting.
5
Daily Riders not always the same people.
Total Annual
Year 1 Year 2 Year 3* Year 3: 12 mo. Projection**
June 30 - July 1
Fiscal Year
636,029 716,847 313,365 734,768
Jan 1 - Dec 31
Calendar Year
289,506 717,021 659,714 717,561
Aug 25 - Aug 24
Start of Service Year
721,790 706,188 201,052 723,843
*PARTIAL YEAR - Data as posted through November 30, 2019.
Average Weekday Riders
Year 1 Year 2 Year 3* Year 3 v. Year 2
Fiscal Year
2,256 2,420 2,583
+6.7% Calendar Year
2,266 2,357 2,471
+4.8% Start of Service Year
2,301 2,407 2,656
+10.3% ** Projections based on actuals to date, WITHOUT Larkspur, Downtown Novato, or New Service Schedule. 6
TOTAL Average Weekday Average Weekend/Holiday YEAR 1 Sep 2017 - Nov 2017 178,597 2,230 1,492 YEAR 2 Sep 2018 - Nov 2018 180,580 2,488 908 YEAR 3 Sep 2019 - Nov 2019 185,162 2,645 951 Year 3 vs. Year 2 +2.5% +6.3% +4.7%
7
8
9
10
11
▪ Clipper Tag On/Tag Off ▪ Mobile App Activation
12
13
14
▪ Free Fare service days (29 free days to date)
▪ Tubbs/Kincade Fire free fare periods ▪ SMART 1-Year Anniversary ▪ Thanksgiving Weekend 2019
▪ Promotional free programs
▪ Veterans & Active Duty Military Families Ride Free (Memorial & Veterans Day Weekends) ▪ Kids Ride Free Weekends/Holidays Summer 2019 ▪ Post-Tubbs Fire community & business relief passes (10,000) ▪ 1 millionth rider milestone ▪ 100,000 bicycles milestone
▪ Kids Under 5 Free ▪ Riders who fail to Tag On/Off or Activate their Mobile App ticket
15
16
17
18
On Board Manual Count vs. Paid Fare Media Ridership
19
20
21
22
23
24
Monday Tuesday Wednesday Thursday Friday Saturday Sunday
Total
TOTAL BIKES TOTAL WHEELCHAIRS Total Manual Count
251,263 278,218 284,504 280,978 283,262 134,510 116,295
1,629,030 159,653 6,087
Total Paid Fare Count
223,407 248,967 252,196 249,434 240,246 105,040 92,861
1,412,151
Clipper Tags 196,896 222,246 224,108 220,622 204,600 71,732 62,392 1,202,596 Mobile App Activations 26,511 26,721 28,088 28,812 35,646 33,308 30,469 209,555
25
50,000 100,000 150,000 200,000 250,000 300,000 Monday Tuesday Wednesday Thursday Friday Saturday Sunday
Overall Passenger Counts
Manual Count Clipper Tags Mobile App Activations
weekends, indicating higher % of infrequent or tourist riders.
shut offs every year.
26
500 1,000 1,500 2,000 2,500 3,000
Monthly Weekday Average (Manual Count)
27
500 1,000 1,500 2,000 2,500
Monthly Weekend/Holiday Average (Manual Count)
August 2018 Free Fare Day skews August 2018 results. Looking at longer term trends is more meaningful.
28
500 1,000 1,500 2,000 2,500 3,000
Monthly Weekday Average (Manual Count)
500 1,000 1,500 2,000 2,500 3,000
Monthly Weekday Average (Paid Fares)
Free Fare days result in significant drop in Paid Fare ridership. On Board Manual Counts not subject to the same variability.
29
500 1,000 1,500 2,000 2,500
Monthly Weekend/Holiday Average (Manual Count)
200 400 600 800 1,000 1,200 1,400 1,600 1,800
Monthly Weekend/Holiday Average (Paid Fares)
Weekend/Holiday ridership trend downward in FY19 with rebound in FY20. Sonoma County Tourism negatively impacted by Fires & PGE Power Shut Offs each year. Jan 2020 new service schedule earlier on weekends in response to public comments.
30
31
32
Sample Monthly Board Report: Key Ridership Statistics
November 30, 2019 1. Cumulative From Start Of Service August 2017: Bicycles Carried to Date: 159,653 Wheelchairs to Date: 6,087
Monday Tuesday Wednesday Thursday Friday Saturday Sunday
Total
Total Manual Count
251,263 278,218 284,504 280,978 283,262 134,510 116,295
1,629,030
Total Paid Fare Count
223,407 248,967 252,196 249,434 240,246 105,040 92,861
1,412,151
November Year To Date Total Ridership (Manual) 64,966 313,365 Total Ridership (Paid) 32,458 244,837 Average Weekday Ridership (Manual) 2,765 2,583 Average Weekday Ridership (Paid) 1,548 2,104 Average Weekend/Holiday Ridership (Manual) 1,131 1,010 Average Weekend/Holiday Ridership (Paid) 276** 610** Total Bicycles Onboard 6,902 37,013 Total Wheelchairs Onboard 277 1,133 *Data subject to revision due to calibration with ongoing additional ridership analyses. ** Weekend Paid Counts significantly affected by free service days November 2019 Report*
33
34
35