
SLIDE 1
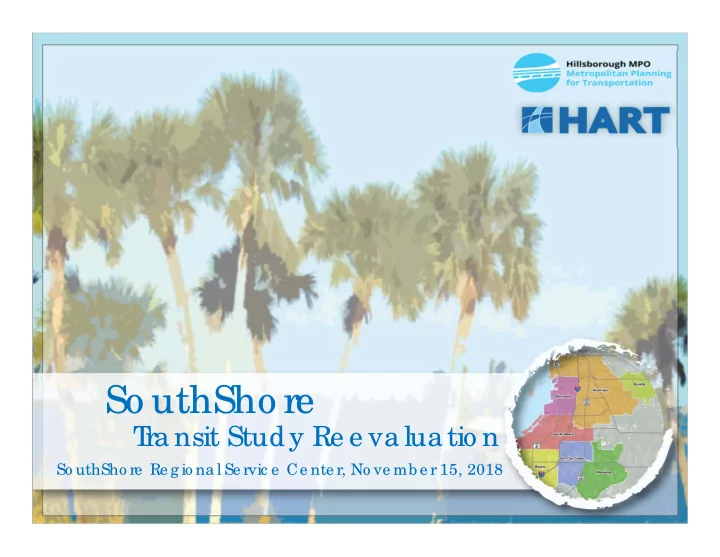
So uthSho re
T ra nsit Study Re e va lua tio n
So uthSho re Re g io na l Se rvic e Ce nte r, No ve mb e r 15, 2018
So uthSho re T ra nsit Study Re e va lua tio n So uthSho re Re g - - PowerPoint PPT Presentation
So uthSho re T ra nsit Study Re e va lua tio n So uthSho re Re g io na l Se rvic e Ce nte r, No ve mb e r 15, 2018 Study Ove rvie w Re e va lua te tra nsit ne e ds E xplo re g ro wth in the a re a Co o rdina te with the MPO a
So uthSho re Re g io na l Se rvic e Ce nte r, No ve mb e r 15, 2018
Planning Area Size Apollo Beach 24 sq mi Boyette 13 sq mi Gibsonton 14 sq mi Riverview 50 sq mi Ruskin 19 sq mi Sun City Center 17 sq mi Wimauma 25 sq mi
Re fine me nts
– 23’ , 20 pa sse ng e r
b use s to se rve the no rth a nd so uth lo o ps
– Ro ute 1 (E
xisting Ro ute 53L X) a s a limite d e xpre ss ro ute
Re c o mme nde d Alte rna tive : Alt 4: T wo T wo -Wa y L
xte nde d F le x to Rive rvie w Hig h Sc ho o l, No F ishha wk E xte nsio n
Service Characteristics: South County US 41 Weekday 5:00 AM – 7:40 PM 75 minutes Fishhawk South Tampa Weekday 5:10 AM – 6:40 AM 3:15 PM – 4:40 PM 15 minutes
South County Flex
Weekday 6:00 AM – 7:00 PM 60 minutes
Service Characteristics: South County US 41 1 ‐ US 301 Weekday 6:00 AM – 9:00 AM 30 minutes 9:00 AM – 8:00 PM 60 minutes Saturday 9:00 AM – 8:00 PM 60 minutes
South County Flex
Weekday 9:00 AM – 8:00 PM 60 minutes
Service Characteristics: 2A ‐ I‐75 Express to Gibsonton Weekday 5:00 AM – 9:00 AM 60 minutes 4:00 PM – 8:00 PM 60 minutes
Service Characteristics: 2B ‐ I‐75 Express to Downtown Weekday 5:00 AM – 9:00 AM 60 minutes 4:00 PM – 8:00 PM 60 minutes 3 ‐ South Loop Weekday 9:30 AM – 3:30 PM 30 minutes
Service Characteristics: 4 ‐ North Loop Weekday 9:30 AM – 3:30 PM 30 minutes
Service Characteristics: 5 ‐ Fishhawk HSF Weekday 5:00 AM – 9:00 AM 30 minutes 4:00 PM – 8:00 PM 30 minutes *Bloomingdale Route connect with Fishhawk at Sports Complex Park‐N‐Ride Weekday 5:00 AM – 9:00 AM 30 minutes 4:00 PM – 8:00 PM 30 minutes
Operational Capital 1 ‐ US 301 $3,030,400 $7,707,500 2 ‐ I‐75 Gibsonton $3,458,800 $8,969,900 3 ‐ I‐75 Downtown/South Loop $4,907,000 $11,686,700 4 ‐ North Loop $5,395,800 $12,127,000 5 ‐ Fishhawk HSF Connection $9,452,200 $15,914,100 Implementation Phase Annual Cost*
* Rounded to the nearest $100.
2025 2035 1 ‐ US 301 735 855 2 ‐ I‐75 Gibsonton 770 910 3 ‐ I‐75 Downtown/South Loop 950 1,110 4 ‐ North Loop 960 1,125 5 ‐ Fishhawk HSF Connection 1,725 2,035 Implementation Phase Average Daily Ridership*
* Rounded to the nearest 5.
Source: New Integrated Smart Transport Options (NISTO). http://www.nisto‐project.eu/de/nisto.html