
SLIDE 1
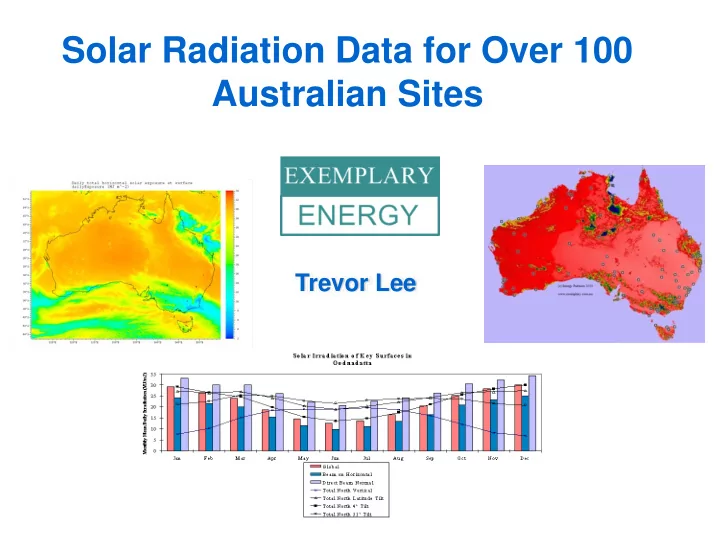
Solar Radiation Data for Over 100 Australian Sites Trevor Lee - - PowerPoint PPT Presentation
Solar Radiation Data for Over 100 Australian Sites Trevor Lee Timeline 1974 Spencer Tables Spencer 1976 Pioneering work of Paltridge and Proctor 1988 First Edition: Australian Solar Radiation Data Handbook (ASRDH) Frick et al 1991 Major
1974 Spencer Tables Spencer 1976 Pioneering work of Paltridge and Proctor 1988 First Edition: Australian Solar Radiation Data Handbook (ASRDH) Frick et al 1991 Major error in was first revealed by Lee 1992 Second Edition: Corrected Version of the ASRDH 1995 Third Edition of the ASRDH 2006 Fourth Edition of the ASRDH 2012 Fifth Edition of the ASRDH
Australian Government – Bureau of Meteorology – BOM American Society of Heating, Refrigerating and Air-Conditioning Engineers, ASHRAE
0.05 degrees Latitude 0.05 degrees Longitude Almost 280,000 pixels Approximately 5km X 5 km each
1998 – mid 2001 mid 2003 – 2010
Global Horizontal Irradiance W/m2 Direct Normal Irradiance W/m2
Selected from 268 sites in Australia Monthly Data Clear Sky Values of radiation Interpolation method relies on ASHRAE data
Legend for Location (listed in descending order of accuracy): Red G&D Locations using both global and diffuse measurements Orange G Locations using global radiation measurements only, with the diffuse radiation estimated. Blue EST Locations using only estimated data from cloud cover records
Geographic Spread of 99 Sites of the ASRDH Edition 5 plus Willis Island (overlayed on a sample single-hour image from the Exemplary ASEA comprising nearly 280,000 pixels with individual values estimated from satellite observations)
Geographic Spread of the 20 extra ASRDH Edition 5 sites (extra in addition to the 80 Sites of the ACDB 2008) (overlayed on a sample single-hour image from the Exemplary ASEA comprising nearly 280,000 pixels with individual values estimated from satellite observations)
Average Clear Sky
Clearness Index Direct and Global hourly and daily irradiance on a
horizontal plane
Total Hourly and Daily irradiance on a North facing plane
inclined at latitude angle for each month
Total Hourly and Daily Irradiance on a North, East, South,
and West facing Vertical Plane Solar Angles
Azimuth Altitude
Orientation in 1° increments Tilt in 1° increments (including facing down) Depth of overhang Reflectivity of the “ground”
Tables for all geometries of engineering and
Hobart as a Sample of the Spatial Variation Mapped for Capital Cities
Hobart as a Sample of the Spatial Variation Mapped for Capital Cities Seasonal Variation
Geographic Spread of the 28 Sites of the ASRDH Edition 4 (overlayed on a sample single-hour image from the Exemplary ASEA comprising nearly 280,000 pixels with individual values estimated from satellite observations)
weather conditions
– Trevor Lee and David Ferrari – Energy Partners, Master Builders Centre, 1 Iron Knob Street, Fyshwick PO Box 1211, ACT 2609, Australia
DISSEMINATION (Solar 08)
– Trevor Lee – Energy Partners, Master Builders Centre, 1 Iron Knob Street, Fyshwick PO Box 1211, ACT 2609, Australia
– Trevor Lee and Mark Snow – Energy Partners, Master Builders Centre, 1 Iron Knob Street, Fyshwick PO Box 1211, ACT 2609, Australia
(Solar 05)
– Barbara Ridley and John Boland – Centre for Industrial and Applicable Mathematics University of South Australia Mawson Lakes Boulevard, Mawson Lakes SA 5095, Australia