
SLIDE 1
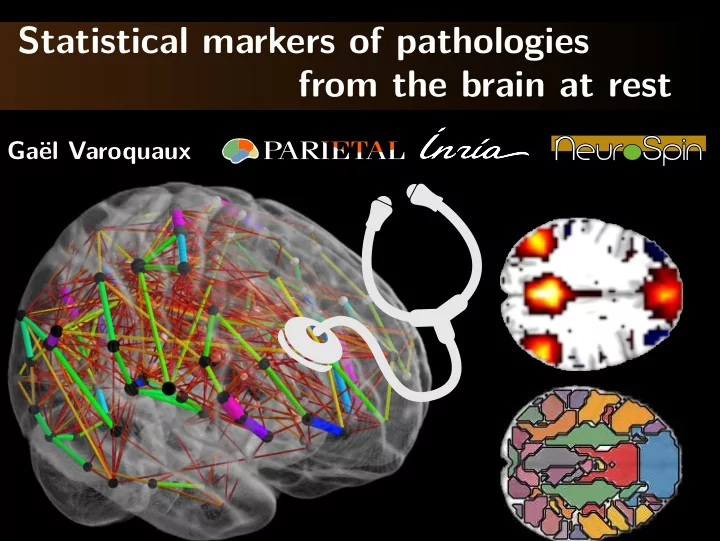
Statistical markers of pathologies from the brain at rest
Ga¨ el Varoquaux
Statistical markers of pathologies from the brain at rest Ga el - - PowerPoint PPT Presentation
Statistical markers of pathologies from the brain at rest Ga el Varoquaux Probing variations of the mind Psychiatry is defined by symptoms Diagnostic and Statistical Manual of Mental Disorders No known physio-pathology; Autism = ?
Ga¨ el Varoquaux
G Varoquaux 2
UK Biobank [Miller... 2016]
G Varoquaux 2
G Varoquaux 3
[Varoquaux and Craddock 2013]
G Varoquaux 3
[Varoquaux and Craddock 2013]
G Varoquaux 3
[Varoquaux and Craddock 2013]
G Varoquaux 3
G Varoquaux 4
[Smith... 2011]
G Varoquaux 5
anatomical atlases, functional atlases, region-extraction methods
G Varoquaux 5
G Varoquaux 5
Harvard Oxford AAL
G Varoquaux 6
... ... ...
G Varoquaux 7
(smooth the data) Related to [Yeo... 2011]
[Craddock... 2012]
(even with many clusters)
G Varoquaux 8
[Thirion... 2014]
(smooth the data) Related to [Yeo... 2011]
[Craddock... 2012]
(even with many clusters)
G Varoquaux 8
Time courses G Varoquaux 9
Time courses Language G Varoquaux 9
Time courses Audio G Varoquaux 9
Time courses Visual G Varoquaux 9
Time courses Dorsal Att. G Varoquaux 9
Time courses Motor G Varoquaux 9
Time courses Salience G Varoquaux 9
Time courses Ventral Att. G Varoquaux 9
Time courses Parietal G Varoquaux 9
Time courses
Observe a mixture
G Varoquaux 9
time voxels time voxels time voxels
25
[Kiviniemi 2003, Beckmann 2005, Varoquaux 2010]
G Varoquaux 10
time voxels time voxels time voxels
25
[Kiviniemi 2003, Beckmann 2005, Varoquaux 2010]
G Varoquaux 10
time voxels time voxels time voxels
25
[Kiviniemi 2003, Beckmann 2005, Varoquaux 2010]
G Varoquaux 10
S, E
2 + λ
G Varoquaux 11
[Varoquaux... 2011, Abraham... 2013]
argmin
Es,Ss,S
Fro + µSs − S2 Fro
G Varoquaux 12
[Varoquaux... 2011, Abraham... 2013]
argmin
Es,Ss,S
Fro + µSs − S2 Fro
G Varoquaux 12
[Varoquaux... 2011, Abraham... 2013]
argmin
Es,Ss,S
Fro + µSs − S2 Fro
[Gramfort... 2013]
Gain in TV and l1 No gain in TV G Varoquaux 12
Downloadable from Parietal webpage http://team.inria.fr/parietal
[Abraham... 2013]
MSDL Group ICA Ward K-Means
[Abraham... 2013]
MSDL Group ICA Ward K-Means
[Abraham... 2013]
MSDL Group ICA Ward K-Means
AAL Smith 2009 ICAs Craddock 2011 Ncuts Abraham 2013 TV-MSDL Ward Harvard- Oxford High model
K-Means Varoquaux 2011 Smooth- MSDL Yeo 2011 G Varoquaux 15
AAL Smith 2009 ICAs Craddock 2011 Ncuts Abraham 2013 TV-MSDL Ward Harvard- Oxford High model
K-Means Varoquaux 2011 Smooth- MSDL Yeo 2011 G Varoquaux 15
G Varoquaux 16
[Zalesky... 2012]
G Varoquaux 17
G Varoquaux 18
G Varoquaux 18
2XT Σ−1X
G Varoquaux 19
1 2 3 4
1 2 3 4
G Varoquaux 20
G Varoquaux 20
i,j = 0
[Smith... 2011, Varoquaux... 2010b]
[Varoquaux and Craddock 2013] G Varoquaux 21
5 10 15 20 25 5 10 15 20 25 5 10 15 20 25 5 10 15 20 25 5 10 15 20 25 5 10 15 20 25 5 10 15 20 25 5 10 15 20 25
5 10 15 20 25 5 10 15 20 25 5 10 15 20 25 5 10 15 20 25 5 10 15 20 25 5 10 15 20 25 5 10 15 20 25 5 10 15 20 25
G Varoquaux 22
5 10 15 20 25 5 10 15 20 25Control 5 10 15 20 25 5 10 15 20 25Control 5 10 15 20 25 5 10 15 20 25Control 5 10 15 20 25 5 10 15 20 25Large lesion
5 10 15 20 25 5 10 15 20 25Control 5 10 15 20 25 5 10 15 20 25Control 5 10 15 20 25 5 10 15 20 25Control 5 10 15 20 25 5 10 15 20 25Large lesion
[Varoquaux... 2010a] G Varoquaux 22
G Varoquaux 23
[Rao 1945]
G Varoquaux 24
[Rao 1945]
G Varoquaux 24
Controls Patient
2
Ctrl ΣPatientΣ− 1/
2
Ctrl
G Varoquaux 24
G Varoquaux 25
5 10 15 20 25 5 10 15 20 25Control 5 10 15 20 25 5 10 15 20 25Control 5 10 15 20 25 5 10 15 20 25Control 5 10 15 20 25 5 10 15 20 25Large lesion
5 10 15 20 25 5 10 15 20 25Control 5 10 15 20 25 5 10 15 20 25Control 5 10 15 20 25 5 10 15 20 25Control 5 10 15 20 25 5 10 15 20 25Large lesion
5 10 15 20 25 5 10 15 20 25Control 5 10 15 20 25 5 10 15 20 25Control 5 10 15 20 25 5 10 15 20 25Control 5 10 15 20 25 5 10 15 20 25Large lesion
[varoquaux 2010] G Varoquaux 26
G Varoquaux 27
[Di Martino... 2014]
Training set T esting set
G Varoquaux 28
Functional connectivity Time series
ROIs
[Abraham... 2016]
G Varoquaux 29
Functional connectivity Time series
ROIs
[Abraham... 2016]
Seen sites 67±3 Unseen sites 67±5
G Varoquaux 29
Functional connectivity Time series
ROIs
[Abraham... 2016]
Seen sites 67±3 Unseen sites 67±5
G Varoquaux 29
Functional connectivity Time series
ROIs
G Varoquaux 30
Functional connectivity Time series
ROIs
G Varoquaux 30
Time series
Functional connectivity
ROIs
G Varoquaux 31
Time series
ROIs Functional connectivity
G Varoquaux 32
Time series
ROIs Functional connectivity
[Varoquaux... 2010a]
G Varoquaux 32
Time series
ROIs Functional connectivity
G Varoquaux 33
Functional connectivity Time series
ROIs
G Varoquaux 34
Functional connectivity Time series
ROIs
G Varoquaux 35
Functional connectivity Time series
ROIs
G Varoquaux 36
Functional connectivity Time series
ROIs
G Varoquaux 36
Accuracy Fraction of subjects used
[Dadi... 2016]
[Liem... 2016]
[Abraham... 2014]
[Abraham... 2016]
total-variation constrained dictionary learning. In MICCAI, page
Machine learning for neuroimaging with scikit-learn. Frontiers in neuroinformatics, 8, 2014.
biomarkers from multi-site resting-state data: An autism-based
constrained spectral clustering. Human brain mapping, 33(8): 1914–1928, 2012.
Comparing functional connectivity based predictive models across datasets. In PRNI 2016: 6th International Workshop on Pattern Recognition in Neuroimaging, 2016.
towards a large-scale evaluation of the intrinsic brain architecture in autism. Molecular psychiatry, 19:659, 2014.
regions from fMRI with TV-L1 prior. In PRNI, pages 17–20, 2013.
Huntenburg, L. Lampe, M. Rahim, A. Abraham, R. C. Craddock, ... Predicting brain-age from multimodal imaging data captures cognitive impairment. NeuroImage, 2016.
uk biobank prospective epidemiological study. Nature Neuroscience, 2016.
statistical parameters. Bull. Calcutta Math. Soc., 37:81, 1945.
modelling methods for fMRI. Neuroimage, 54:875, 2011.
fMRI clustering gives good brain parcellations? Name: Frontiers in Neuroscience, 8:167, 2014.
functional connectomes across subjects. NeuroImage, 80:405, 2013.
in post-stroke patients using group-level covariance modeling. In MICCAI, pages 200–208. 2010a.
covariance selection: better individual functional connectivity models using population prior. In NIPS. 2010b.
562–573, 2011.
as a measure of network connectivity. NeuroImage, 2012.