
SLIDE 1
Table of contents
46
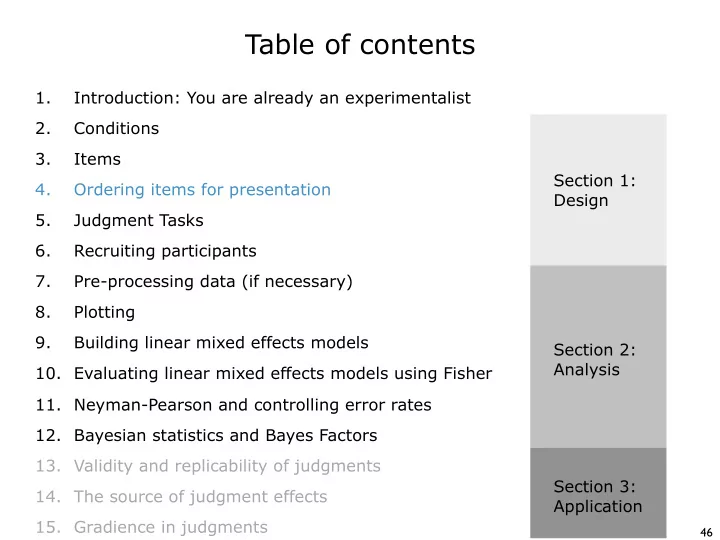
Table of contents 1. Introduction: You are already an - - PowerPoint PPT Presentation
Table of contents 1. Introduction: You are already an experimentalist 2. Conditions 3. Items Section 1: 4. Ordering items for presentation Design 5. Judgment Tasks 6. Recruiting participants 7. Pre-processing data (if necessary) 8.
46
47
memory parsing world thought
48
Who __ thinks that Jack stole the car? non-island short Condition 1: Who __ thinks that Amy stole the gold? Who __ thinks that Dale stole the pie? Who __ thinks that Pat stole the pen?
wh.non.sh.01 wh.non.sh.02 wh.non.sh.03 wh.non.sh.04 wh.non.sh.01 whether island short non-island set 1
49 Who __ thinks that Jack stole the car? Who __ thinks that Amy stole the gold? Who __ thinks that Dale stole the pie? Who __ thinks that Pat stole the pen? wh.non.sh.01 wh.non.sh.02 wh.non.sh.03 wh.non.sh.04 What do you think that Jack stole __? What do you think that Amy stole __? What do you think that Dale stole __? What do you think that Pat stole __? wh.non.lg.01 wh.non.lg.02 wh.non.lg.03 wh.non.lg.04 Who __ wonders whether Jack stole the car? Who __ wonders whether Amy stole the gold? Who __ wonders whether Dale stole the pie? Who __ wonders whether Pat stole the pen? What do you wonder whether Jack stole __? What do you wonder whether Amy stole __? What do you wonder whether Dale stole __? What do you wonder whether Pat stole __? wh.isl.lg.01 wh.isl.lg.02 wh.isl.lg.03 wh.isl.lg.04 wh.isl.sh.01 wh.isl.sh.02 wh.isl.sh.03 wh.isl.sh.04
50
Who __ thinks that Jack stole the car? Who __ thinks that Amy stole the gold? Who __ thinks that Dale stole the pie? Who __ thinks that Pat stole the pen? wh.non.sh.01 wh.non.sh.02 wh.non.sh.03 wh.non.sh.04 What do you think that Jack stole __? What do you think that Amy stole __? What do you think that Dale stole __? What do you think that Pat stole __? wh.non.lg.01 wh.non.lg.02 wh.non.lg.03 wh.non.lg.04 Who __ wonders whether Jack stole the car? Who __ wonders whether Amy stole the gold? Who __ wonders whether Dale stole the pie? Who __ wonders whether Pat stole the pen? What do you wonder whether Jack stole __? What do you wonder whether Amy stole __? What do you wonder whether Dale stole __? What do you wonder whether Pat stole __? wh.isl.lg.01 wh.isl.lg.02 wh.isl.lg.03 wh.isl.lg.04 wh.isl.sh.01 wh.isl.sh.02 wh.isl.sh.03 wh.isl.sh.04
51
List 1 List 2 List 3 List 4 wh.non.sh.01 wh.non.sh.02 wh.non.sh.03 wh.non.sh.04 wh.non.lg.02 wh.non.lg.03 wh.non.lg.04 wh.non.lg.01 wh.isl.sh.03 wh.isl.sh.04 wh.isl.sh.01 wh.isl.sh.02 wh.isl.lg.04 wh.isl.lg.01 wh.isl.lg.02 wh.isl.lg.03
Who __ thinks that Jack stole the car? Who __ thinks that Amy stole the gold? Who __ thinks that Dale stole the pie? Who __ thinks that Pat stole the pen? wh.non.sh.01 wh.non.sh.02 wh.non.sh.03 wh.non.sh.04 What do you think that Jack stole __? What do you think that Amy stole __? What do you think that Dale stole __? What do you think that Pat stole __? wh.non.lg.01 wh.non.lg.02 wh.non.lg.03 wh.non.lg.04 Who __ wonders whether Jack stole the car? Who __ wonders whether Amy stole the gold? Who __ wonders whether Dale stole the pie? Who __ wonders whether Pat stole the pen? What do you wonder whether Jack stole __? What do you wonder whether Amy stole __? What do you wonder whether Dale stole __? What do you wonder whether Pat stole __? wh.isl.lg.01 wh.isl.lg.02 wh.isl.lg.03 wh.isl.lg.04 wh.isl.sh.01 wh.isl.sh.02 wh.isl.sh.03 wh.isl.sh.04 List 1 List 2 List 3 List 4
52
List 1 List 2 List 3 List 4 wh.non.sh.01 wh.non.sh.02 wh.non.sh.03 wh.non.sh.04 wh.non.lg.02 wh.non.lg.03 wh.non.lg.04 wh.non.lg.01 wh.isl.sh.03 wh.isl.sh.04 wh.isl.sh.01 wh.isl.sh.02 wh.isl.lg.04 wh.isl.lg.01 wh.isl.lg.02 wh.isl.lg.03
A B C D B C D A C D A B D A B C List 1 List 2 List 3 List 4 wh.non.sh 1 2 3 4 wh.non.lg 2 3 4 1 wh.isl.sh 3 4 1 2 wh.isl.lg 4 1 2 3
53
54
55
56
57
58
59
60
61
62
63
64
65
66
67
68
69
70
71
72
73