SLIDE 1
1
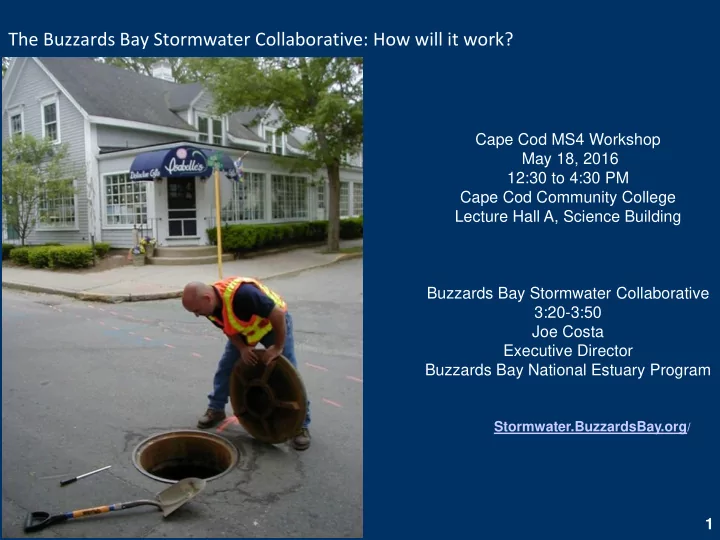
The Buzzards Bay Stormwater Collaborative: How will it work?
Cape Cod MS4 Workshop May 18, 2016 12:30 to 4:30 PM Cape Cod Community College Lecture Hall A, Science Building Buzzards Bay Stormwater Collaborative 3:20-3:50 Joe Costa Executive Director Buzzards Bay National Estuary Program
Stormwater.BuzzardsBay.org/
SLIDE 2
2
The Buzzards Bay NEP and BBAC have been working with Buzzards Bay watershed towns to map stormwater networks since 2002
Water quality information is required to make funding decisions.
Database now includes 8,500 stormwater discharges and 40,000+ catchbasins
2
SLIDE 3 3
The first "stormwater mapping collaborative" for Buzzards Bay (2003-2007) was created in response to the issuance of the first phase 2 MS4 permit in 2003
Secretary of Environmental Affairs, Ellen Roy Herzfelder (center), CZM Director, Susan Snow-Cotter (left), and State Representative Shirley Gomes (right center) award a grant certificate award to Leonard Gonsalves (left center) of the Buzzards Bay Action Committee, who will be working with Greater New Bedford Voc Tech High School Students, and their instructor Chris Pires (far right), to implement the grant.
CZM grant to the BBAC. They used interns from New Bedford Voc Tech and all worked with the Buzzards Bay NEP
SLIDE 4 4
The reason for the Buzzards Bay NEP focus on stormwater is that stormwater discharges are often a major contributor to shellfish bed closures
Year-round closures: red and magenta shaded Seasonal or rain closures: yellow Some closures are mandatory closures around wastewater
SLIDE 5 Discharges , Management Areas, and the Bacteria TMDL for Buzzards Bay
First, note that the state's list of bacteria/pathogen impaired waters might need to be reclassified to match actual DMF shellfish classification and BOH Beach classifications and municipal accomplishments to improve water quality. 5 Note MS4 areas.
We need to reclassify 303d bacteria impaired listed areas!
Stormwater discharges SA Shellfish: geomean (Fecal Coliform) <= 14
shall 10% be >=28 organisms/100 ml
SLIDE 6
Stormwater Collaborative Proposed in EPA’s Healthy Community Grant Program
BBAC was the recipient of the $200k Healthy Communities Program grant at the end of 2015 to map stormwater networks and monitor discharges to impaired surface waters in five municipalities (grant will get the program off the ground and 1.5 year of monitoring). The Buzzards Bay NEP is committing its own staff and resources.
New proposal to EPA SNEP: Add Marion and Bourne and extend effort by 1.5 years, 6
SLIDE 7 7
Why just mapping (GIS) and monitoring?
The monitoring and mapping components were previously identified as the most challenging and expensive tasks for municipalities in the new MS4 permit. The BB Collaborative will focus on MS4 and Non-MS4 areas.
Buttermilk Way Bourne success story: shellfish area reopened after construction of stormwater treatment system.
SLIDE 8
Staffing to the Initiative
Joe Costa Buzzards Bay NEP Executive Director QA officer Jeff Osuch BBAC Project Manager (part time: finances and administrative) Betsy White BBAC Stormwater Specialist (full time, monitoring lead sample and field data collection) 4-5 Interns, full time summer or seasonal, part-time year round (assist with collection of water samples, delivery to laboratory, GIS support) Kevin Bartsch BBNEP Stormwater Specialist: GIS Management Bernadette Taber BBNEP Stormwater Specialist (pt): Monitoring Program guidance, QAPP Municipal DPWs: 100 hours field support, scheduled as needed, required participation if manhole covers need to be removed. Conservation or BOH agent may participate in some towns Public Crowdsourcing Scientist partners? 8 BBNEP BBAC
SLIDE 9 9
Overview of Initiative Elements
Overall Goals
- Identify illicit connections
- Set priorities for management action
- Help municipalities identify problem infrastructure
- Long term: Eventually lead to stormwater designs and construction to treat NPS
pollution to open up closed shellfish beds
Task
- Update and reconfigure the original stormwater GIS database to incorporate details of
infrastructure
- Collection of photographs of infrastructure in the database
- Field testing of discharges, some screening tests on samples brought back to the office,
- ther samples collected for laboratory analysis
- Laboratory analysis details
- Prioritization of discharges for management action will be based on monitoring data and GIS
analysis
- Online availability of GIS and water quality data
Challenge: trying to capture unpredictable rain events.
SLIDE 10
Overview of Initiative Elements
Task Lead and Partners Update and reconfigure the original stormwater GIS database to incorporate details of infrastructure BB NEP will do the database management, municipality provides road as built, plans, assist with any needed fieldwork. Mostly a desktop effort. BBAC interns bring a large format scanner to DPW offices , and will geo referencing plans at BBAC offices in ArcGIS. Collection of photographs of infrastructure in the database. Staff and Towns, but also a major effort to get the volunteers involved (“Crowdsourcing”) using mobile device apps. Field testing of discharges, some screening tests on samples brought back to the office. Other samples collected for laboratory analysis BBAC staff, BBNEP staff, town staff, possibly volunteers in future? Generally 2 town staff and a truck will be present if monitoring involves manhole cover removal. Results of field screening and test will trigger additional up gradient sampling Laboratory Analysis details Most samples will be tested at Barnstable County, but some testing at New Bedford Dept. of Public Health. Prioritization based on monitoring data and GIS analysis BB NEP with input from municipalities Online availability of GIS and water quality data BB NEP manages web products Eventually lead to stormwater treatment design for priority sites BB NEP has a grant application to EPA SNEP to fund municipal stormwater treatment designs Construction of stormwater treatment systems for priority sites Municipality with federal and state grant support
10
SLIDE 11
Crowdsourcing element to collect photographs and identify problem infrastructure.
11
SLIDE 12 Interactive Map at stormwater.buzzardsbay.org
Both staff and the public will submit photos from smart phones and tablets in the field. Photos will be taken to document dry weather conditions and wet flow. Click the refresh button, and you will be able to see where you are (you should be somewhere in the big red and yellow box), click on a mapped discharge, then click the upload photo link, and add a photo, and other information. Use voice to text.
12 If you find a new discharge or catch basin, drag the blue crosshairs (off to the right) to the precise location of the feature. Then long-hold (or double-click
- n a computer) the crosshairs to
upload a photo and other info about the feature.
SLIDE 13
Interactive Map Upload Screen
13
SLIDE 14 Sampling Locations
- Discharge Points in the MS4 Urbanized Areas that are within 100ft of
Bacteria Impaired Waters or Shellfish Closures
- Includes outfall pipes and road cuts
- Initially based on the Buzzards Bay NEP 2007 Stormwater Atlas update
unless more recent data is available
Municipality All Discharges MS4 Urban Discharges Discharges within 100’
Acushnet
119 69 9
Dartmouth
575 319 44
Fairhaven
354 227 77
Mattapoisett
557 170 41
Wareham
930 669 167
Marion
324 156 45
Bourne
307 263 71
SLIDE 15 Stormwater Monitoring Program
15
QAPP approved by EPA in March
SLIDE 16 Water Quality Parameters selected for source tracking of illicit connections and prioritization of discharges for treatment systems for NPS pollution
Parameter Indication of: Surfactants Washing machine or sewer connection Ammonia as Nitrogen Sewer connection Temperature temperature variations might indicate proximity to illicit
- connections. Also to document potential temperature
impacts to aquatic life. Conductivity Saline conditions >3 ppt would indicate tidal intrusion into the network, and the need to go further upstream for a clean stormwater signal. Salinity can also affect some tests (e.g. surfactants). Nitrogen as Nitrates Sewer connection or fertilizer runoff Enterococci Human or warm blooded fecal matter contamination. Indicator for swimming beach classification. Fecal Coliform Human or warm blooded fecal matter contamination. Indicator for shellfish areas classification. Chlorine (optional) Connection to swimming pools 16
SLIDE 17 Sampling approach
17
- Three Wet Samplings -- Four Dry Samplings
- Wet Sampling – During “First Flush”
– No Rain 72 hours before current rainfall event – Overland flow and pipe flow must be occurring – Sample from 0.1 to 1.5 inches of rainfall
- Dry Sampling – complete observation
– Collect water only if flow is present
- Grab with one clean sterile 500 ml bottle, split to:
- Field sample cups for Ammonia strips and pH, temp.,
and conductivity probes
- One 125ml bottle for office analysis within 24hrs (nitrates,
surfactants)
- Two 100ml sterile cups for the laboratory in Barnstable
(fecal coliform and Enterococcus)
- Samples to be delivered to Barnstable by 2 PM
- Limits collection time to morning
SLIDE 18
Sampling schematic
18 If pipe is submerged or discharging salt water, you need to move up gradient. When you remove a drain cover you may discover several inlets.
SLIDE 19
Sample Collection Data Sheet
19
SLIDE 20
Training
20 Equipment manuals, guides, and training videos posted at: stormwater.buzzardsbay.org/monitoring.html
SLIDE 21 Ongoing tasks
21
- Assess sampling locations
– Find and evaluate outfalls – Remove covers and check manholes – Clear obstructions from discharge pipes, manholes – Identify safety issues
– Dry Weather – observation or sample – Wet Weather – sample – Identify best contaminant indicators – Field Inspections and photo collection – Identify failing infrastructure (filled catch basins, clogged pipes, etc.) – Crowdsourcing and public involvement to identify problems and sources – Over time: testing new indicators for source tracking, evaluating repurposing commercial kits, testing new approaches, etc.
– Synthesis of data to find hot spots and illicit connections – Help define relative impacts from pets, agriculture, industry…