1 / 18
New Approach to Measure Urban Poverty:
THE CASE OF NOUAKCHOTT
Paper presented at the XXV111 International Population Conference,. Cape Town, South Africa 29th of October- 4th of November 2017
- Dr. Osman Nour
THE CASE OF NOUAKCHOTT Dr. Osman Nour, Arab Urban Development - - PDF document
New Approach to Measure Urban Poverty: THE CASE OF NOUAKCHOTT Paper presented at the XXV111 International Population Conference,. Cape Town, South Africa 29 th of October- 4 th of November 2017 Dr. Osman Nour Arab Urban Development Institute
1 / 18
2 / 18
3 / 18
4 / 18
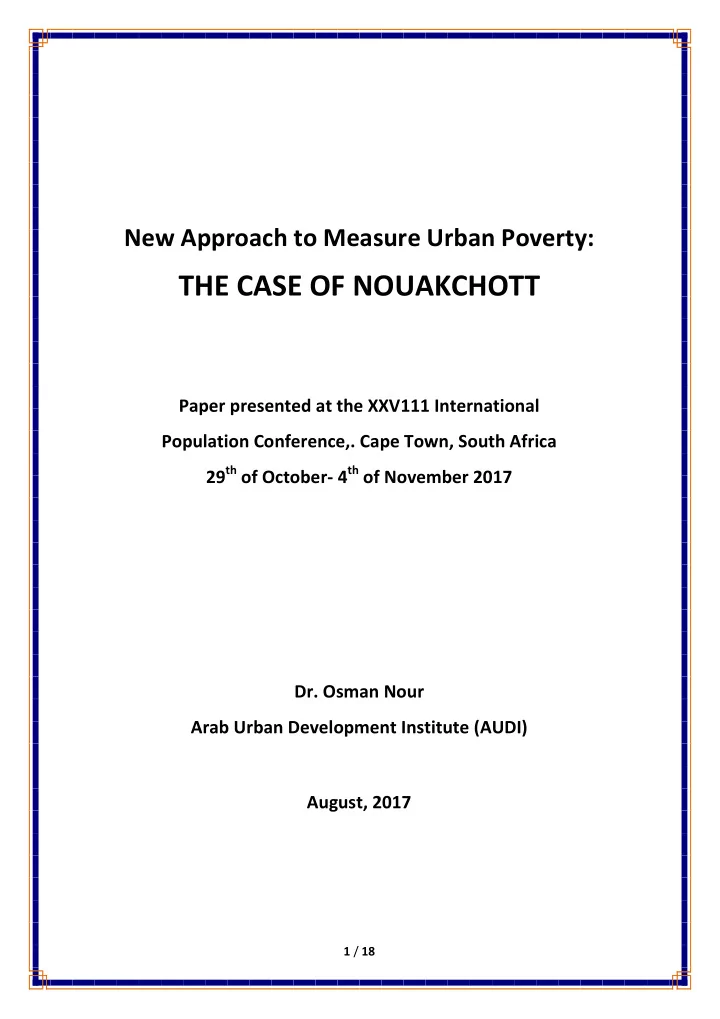
FIGURE 1: DISTRICTS OF NOUAKCHOTT AND THEIR SHARES IN THE SAMPLE
DISTRICT NUMBER OF HH WEIGHTED NUMBER OF HH Teyarett 280 18,367 Ksar 200 13,554 Tefragh-Zeina 240 16,147 Toujounin 280 15,350 Sebkha 300 15,540 El Mina 480 22,113 Dar Naim 300 22,019 Arafat 380 25,068 Riad 240 14,268 TOTAL 2,700 162,424
5 / 18
6 / 18
7 / 18
TABLE2: LIST OF SIGNIFICANT VARIABLES
No. Field Variable 1 Dwelling Area of dwelling 2 Amenities Type of service water 3 Amenities Sanitary sewerage 4 Economic Bank account 5 Economic Not going to the doctor for financial reasons 6 Nutrition Weekly consumption of chicken 7 Nutrition Weekly consumption of sweets 8 Equipment Possession of cable subscription 9 Equipment Possession of air condition 10 Equipment Possession of fixed telephone line 11 Equipment Car ownership 12 Information Reading newspapers and magazines 13 Information Browsing the internet outside work
8 / 18
9 / 18
1 The UBI methodology was first applied to the Household data for Tripoli (Lebanon) using the same questionnaire
10 / 18
Variable Beta (Constant) area per capita 0.155*** Water tanks as main source of drinking water
Sewerage pit or no sewerage 0.041*** Not going to the doctor for financial reasons 0.047*** Weekly consumption of chicken 0.088*** Weekly consumption of sweets 0.032*** Possession of cable subscription 0.026*** Possession of air condition 0.158*** Possession of fixed telephone line 0.108*** Reading newspapers and magazines 0.094*** Browsing the internet outside work 0.18*** Car ownership 0.002 Possession of internet subscription at home 0.091*** Having a bank account 0.076*** head of household having university education
mineral water as main source of drinking water
Visiting cafes and restaurants 0.149*** R 0.564 R-squared 0.318 Adjusted R-squared 0.318 F-statistic 4305.57*** Note: * for p β€ 0.05, ** for p β€ 0.01, ***for p β€0.001
11 / 18
12 / 18
Variable Score Area per capita 131points if area is at least 20m2 / 0 if no Water tanks as main source of drinking water
Sewerage pit or no sewerage 35 points if yes / 0 if no Not going to the doctor for financial reasons 40points if yes / 0 if no Weekly consumption of chicken 74points if at least twice a week / 0 if no Weekly consumption of sweets 27points if at least once a week / 0 if no Possession of cable subscription 22points if yes / 0 if no Possession of air condition 133points if yes / 0 if no Possession of fixed telephone line 91points if yes / 0 if no Reading newspapers and magazines 79points if yes / 0 if no Browsing the internet outside work 152points if yes / 0 if no Possession of internet subscription at home 77points if yes / 0 if no Having a bank account 64points if yes / 0 if no Visiting cafes and restaurants 126points if yes / 0 if no Total 1, 000 points
13 / 18
B-THE RESULTS:
Score Percent Cumulative Percent 0 to 100 12.4% 12.4% 100 to 200 24.7% 37.1% 200 to 300 22.6% 59.7% 300 to 400 18.3% 78% 400 to 500 10.8% 88.8% 500 to 600 7.5% 96.3% 600 to 700 2.4% 98.7% 700 to 800 0.6% 99.3% 800 to 900 0.4% 99.6% 900 to 1,000 0.4% 100% Total 100%
14 / 18
FIGURE 1: HISTROGRAM OF NOUKACHOTT UPI SCORE DISTRIBUTION
15 / 18
FIGURE 2: DISTRIBUTION OF NOUAKCHOTT UPI SCORES ACROSS REGIONS
extreme income poverty Mean Non-poor 403.6904 Poor 206.3062 Total 275.9072
16% 17% 39% 89% 82% 22% 29% 38% 67% 45% 22% 40% 10% 17% 63% 46% 51% 15% 52% 44% 20% 15% 19% 9%
0% 10% 20% 30% 40% 50% 60% 70% 80% 90% 100%
0 to 200 200 to 400 400 to 600 600 to 800 800 to 1000
16 / 18
Score Non-poor poor 0 to 100 2.0% 18.1% 100 to 200 6.2% 34.8% 200 to 300 17.2% 25.7% 300 to 400 27.4% 13.3% 400 to 500 22.1% 4.7% 500 to 600 16.3% 2.6% 600 to 700 5.5% 0.6% 700 to 800 1.5% 0.1% 800 to 900 0.9% 0.1% 900 to 1,000 1.0% Total 100.0% 100.0%
17 / 18
18 / 18