
SLIDE 1
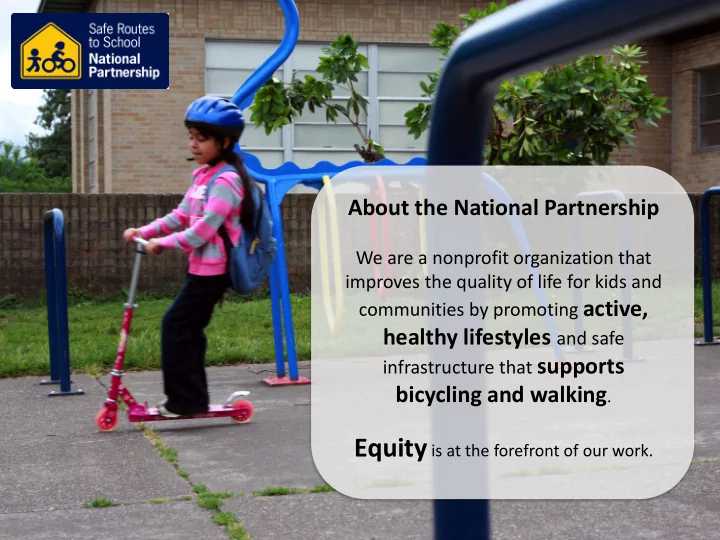
About the National Partnership
We are a nonprofit organization that improves the quality of life for kids and communities by promoting active,
healthy lifestyles and safe
infrastructure that supports
bicycling and walking.
Equity is at the forefront of our work.