
SLIDE 1
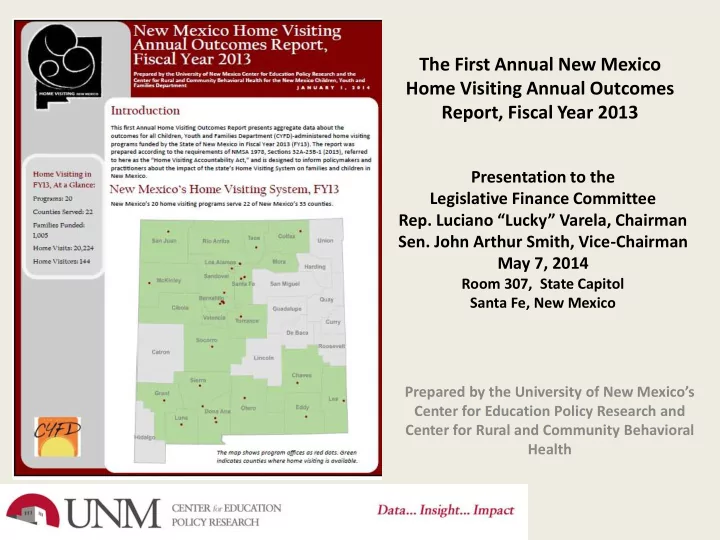
The First Annual New Mexico Home Visiting Annual Outcomes Report, Fiscal Year 2013
Prepared by the University of New Mexico’s Center for Education Policy Research and Center for Rural and Community Behavioral Health
Presentation to the Legislative Finance Committee
- Rep. Luciano “Lucky” Varela, Chairman
- Sen. John Arthur Smith, Vice-Chairman
May 7, 2014
Room 307, State Capitol Santa Fe, New Mexico