THE HIGH RATE DEFORMATION RESPONSE OF 3D WOVEN COMPOSITES M. Pankow - - PDF document

the high rate deformation response of 3d woven composites
SMART_READER_LITE
LIVE PREVIEW

THE HIGH RATE DEFORMATION RESPONSE OF 3D WOVEN COMPOSITES M. Pankow - - PDF document

18 th International Conference on composite materials THE HIGH RATE DEFORMATION RESPONSE OF 3D WOVEN COMPOSITES M. Pankow 1,2,* , A.M. Waas 1 , C.F. Yen 2 and S. Ghiorse 2 1 University of Michigan, Composite Structures Lab, 1320 Beal Ave. Ann


slide-1
SLIDE 1

18th International Conference on composite materials

THE HIGH RATE DEFORMATION RESPONSE OF 3D WOVEN COMPOSITES

  • M. Pankow1,2,*, A.M. Waas1, C.F. Yen2 and S. Ghiorse2

1University of Michigan, Composite Structures Lab, 1320 Beal Ave. Ann Arbor MI 48109 2 Army Research Laboratory, Aberdeen Proving Ground, MD 21005-5069.

*Corresponding author (mpankow@umich.edu) Keywords: 3D woven, DIC, Full Field Measurement, High Strain Rate, Hopkinson Bar

1 General Introduction 3D woven composites (3DWC) are attractive light-weight materials for situations that demand damage tolerance and durability under impact or crash conditions. 3DWC are relatively new materials in the world of composites, however the textile loom weaving technology has been available since the turn of the century. Modern manufacturing techniques incorporate computer controlled looms. In this investigation, 3DWC were manufactured using Jacquard looms and infused using the VARTM

  • process. The material used for the study in this

paper is a S2-glass fiber tow orthogonally woven 3DWC with a toughened epoxy matrix reinforcement. For many new applications, knowledge

  • f the elevated strain rate deformation response
  • f

3DWC is desirable. In particular, experimental data are required to develop mechanics models for the high strain rate deformation response and to formulate failure models for strength prediction. To test extreme rate response, 3DWC was subjected to split Hopkinson pressure bar (SHPB) testing to determine the elevated strain rate compression response of the material. Tests were performed

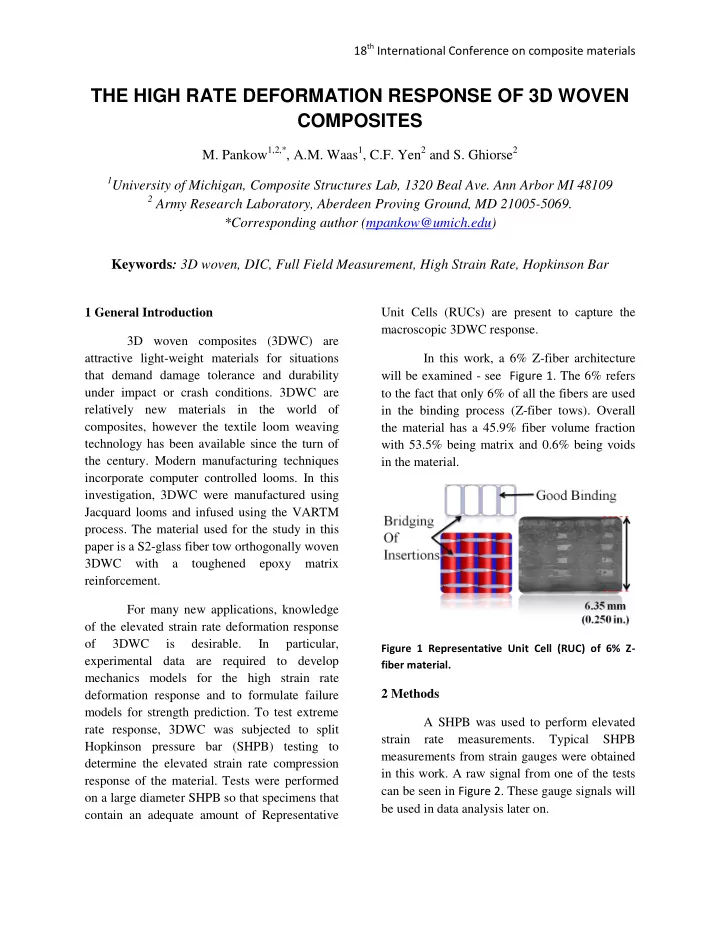
  • n a large diameter SHPB so that specimens that

contain an adequate amount of Representative Unit Cells (RUCs) are present to capture the macroscopic 3DWC response. In this work, a 6% Z-fiber architecture will be examined - see Figure 1. The 6% refers to the fact that only 6% of all the fibers are used in the binding process (Z-fiber tows). Overall the material has a 45.9% fiber volume fraction with 53.5% being matrix and 0.6% being voids in the material.

Figure 1 Representative Unit Cell (RUC) of 6% Z- fiber material.

2 Methods A SHPB was used to perform elevated strain rate measurements. Typical SHPB measurements from strain gauges were obtained in this work. A raw signal from one of the tests can be seen in Figure 2. These gauge signals will be used in data analysis later on.

slide-2
SLIDE 2

18th International Conference on composite materials

Figure 2 Raw strain gauge data for a in-plane warp direction response. Notice the dip in the reflected wave this causes the decreasing strain rate in the material.

Optical Measurements were made using high speed cameras running at 130,000 fps. The raw images from a test are shown in Figure 3. These images were post-processed using the Digital Image Correlation (DIC) technique. The processed images are shown in Figure 4. The images show bands occuring in the material and also the onset of failure in the material. In this sequence of imgaes, subfigure o shows a shear band forming in the material where failure

  • ccurs.

Figure 3 Raw Pictures from SHPB test in the through-the-thickness direction. Images were recorded at 130,000 fps to capture the deformation. Figure 4 Strain X data for same through-the- thickness test.

A section plot has also been created to look at the variation of the strains through the

  • thickness. Figure 5 shows the variation of strains

in the material and also the evolution of strain as a function of time. The contours show that there is some periodic aspect to the strain values. This variation is directly related to different constituents in the material both the fiber matrix tows and also the areas of pure matrix which undergo different amounts of straining during the loading.

Figure 5 Strain variation as a function of distance through- the- thickness. These contour plots show the variation in the material due to the different constituents of fiber and matrix material.

If we compare the average strain from the overall DIC measurements (averaged over the entire viewing area) to the inferred strain gauge measurement, we can determine if what we are measuring from the gauges is the same as

slide-3
SLIDE 3

18th International Conference on composite materials what we measure with the DIC

  • macroscopically.

Figure 6 shows the comparison of the two strain measurements along with the variation that occurs in the DIC

  • measurements. Overall the correlation is very

strong between the two measurements although around 100 µs there is a departure in the strain readings that show that DIC is picking up strains associated with failure in the material. This result is important because the DIC results will not only allow us to determine the results for the

  • verall

composite response, but also to accurately determine the strain concentrations and the locations of failure within the specimen. It also allows us to say that the "effective" properties can be determined from strain gauge measurements.

Figure 6 Comparison of DIC measurements and strain gauge data.

3 Results and Observations Static and elevated strain rate tests were performed to determine the effective stress- strain response as a function of rate in the

  • material. The analysis showed that there was no

rate dependency of the modulus of the material in any orientation. However, the analysis shows both rate dependent strength mechanisms and also a change in failure mode at elevated rates. Figure 7 shows the stress vs. strain response curves for the through-the-thickness

  • direction. These results show an elevated

strength in the material and a near constant strain rate for the test.

Figure 7 Stress vs. strain and strain rate response of the material for a through-the-thickness

  • rientation. The results show that there is a

variation in the response of the failure strength at elevated rates, however the modulus remains constant.

SHPB tests were also done in the in- plane direction. These materials show an increase in failure strength by as much as 100% as the strain rate increases. It was observed that the failure mode in compression is strain-rate dependent.

Figure 8 Stress vs. strain and strain rate for the in- plane direction of the material. The results show that there is a non-constant strain rate and the rate is actually dissipated in the material.

Figure 9 shows the transition in failure that occurs in the material as a function of loading rate. The mode changes from a kink band formation at low strain rates (quasi-static) to delaminations at higher strain rates. This transition corresponds to the transition in

slide-4
SLIDE 4

18th International Conference on composite materials material properties that is exhibited in the SC-15 matrix material. SC-15 changes from a "ductile" like behavior to "brittle" like response with a corresponding elevation in the yield strength. At the low rate the ductile material flows plastically, whereas at an elevated rate the yield strength is elevated suppressing the kinking mode of failure.

Figure 9 Failed specimens from in-plane testing. Notice the transition in failure mode in the material as is goes from kink band formation to delamination at higher rates. This causes and elevated strength in the material.

Individual fiber tow testing is an

  • ngoing investigation. Unidirectional panels

with a fiber tow volume fraction of 56% were fabricated with an SC-15 matrix material. Quasi- static testing has been performed on these materials to determine the response. This information is vital for the understanding of how matrix infused fiber tows respond to different loading conditions. Strain rate dependent data for the matrix material was determined from the SHPB tests and fitted using the Johnson-Cook model. Rate dependent validated models for the matrix and the fiber tows can be used in computational models of 3DWC to determine the effective rate-dependent properties of 3DWC. The results from the computational simulations can then be checked against the SHPB results, including digital image correlation strain maps of the deforming 3DWC, for model validation. 4 Conclusions The use of DIC on SHPB experiments has been performed using high speed cameras to determine time-dependent strains in the material. The results show that the average material response is measured by the strain gauges, however, such a measurement involves strain softening (locally) due to material failure. This result is important because even though the strain waves propagate differently in the material (due to its composite nature) and a uniform strain state is never reached, the results can provide effective properties for a given composite material, prior to accumulation of

  • damage. The test results show that the 3DWC

material has rate dependent mechanical properties and rate dependent failure mechanisms causing transitions in failure

  • modes. These rate dependent failure modes are

due to the influence of the matrix material and it’s rate dependent material behavior. Individual testing of fiber tows will lead to a better overall understanding of the material response.