The prospects for geothermal energy in Scotland Ed Stephens, - - PDF document

the prospects for geothermal energy in scotland
SMART_READER_LITE
LIVE PREVIEW

The prospects for geothermal energy in Scotland Ed Stephens, - - PDF document

The prospects for geothermal energy in Scotland Ed Stephens, University of St Andrews Cairngorms Hot Dry Rocks: Granites Southampton Hot Wet Rocks: Aquifers Scottish Energy Context Installed capacity ~11GW, peak demand ~7GW 2009 TWh %


slide-1
SLIDE 1

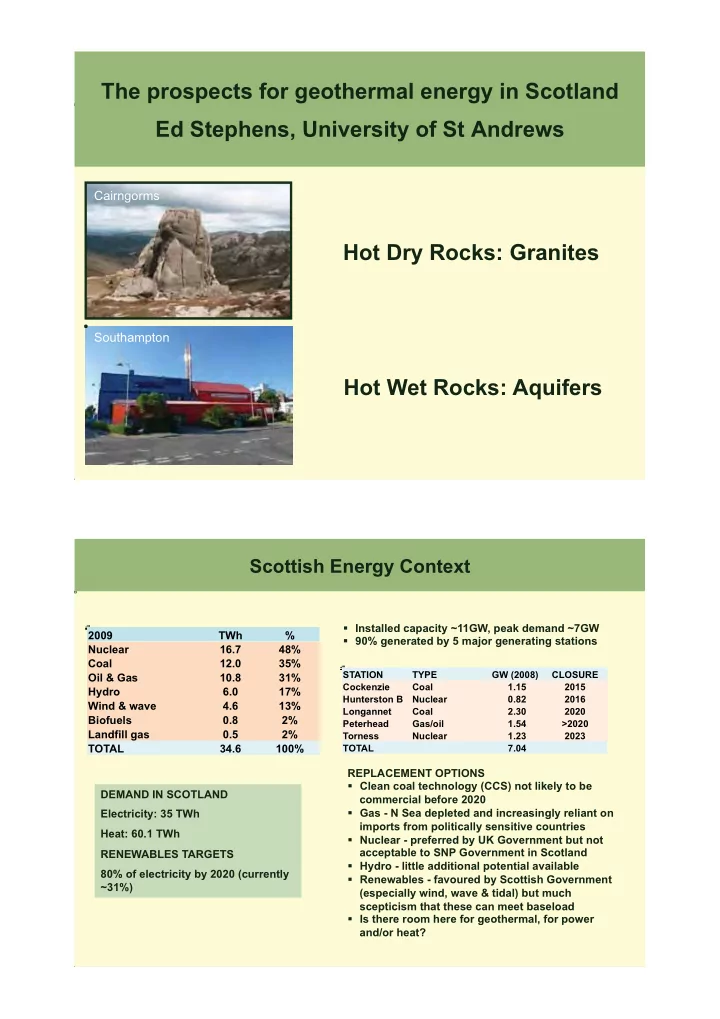
The prospects for geothermal energy in Scotland Ed Stephens, University of St Andrews Hot Dry Rocks: Granites Hot Wet Rocks: Aquifers

Cairngorms Southampton

Scottish Energy Context

DEMAND IN SCOTLAND Electricity: 35 TWh Heat: 60.1 TWh RENEWABLES TARGETS 80% of electricity by 2020 (currently ~31%) Installed capacity ~11GW, peak demand ~7GW 90% generated by 5 major generating stations REPLACEMENT OPTIONS Clean coal technology (CCS) not likely to be commercial before 2020 Gas - N Sea depleted and increasingly reliant on imports from politically sensitive countries Nuclear - preferred by UK Government but not acceptable to SNP Government in Scotland Hydro - little additional potential available Renewables - favoured by Scottish Government (especially wind, wave & tidal) but much scepticism that these can meet baseload Is there room here for geothermal, for power and/or heat?

STATION TYPE GW (2008) CLOSURE Cockenzie Coal 1.15 2015 Hunterston B Nuclear 0.82 2016 Longannet Coal 2.30 2020 Peterhead Gas/oil 1.54 >2020 Torness Nuclear 1.23 2023 TOTAL 7.04

2009 TWh % Nuclear 16.7 48% Coal 12.0 35% Oil & Gas 10.8 31% Hydro 6.0 17% Wind & wave 4.6 13% Biofuels 0.8 2% Landfill gas 0.5 2% TOTAL 34.6 100%

slide-2
SLIDE 2

Innamincka, Australia

  • 1,100 km north of Adelaide,

within Cooper Basin, Australias main oil & gas basin

  • Geothermal resource discovered

in 2001 (Geodynamics)

  • Discovery based on existing heat

flow information

  • 40MW power station under

construction, 500 MW in design

  • Region apparently capable of

supporting several 500 MW stations

  • Estimates of Cooper Basin

capacity range from 10-30 GW

Images from Geodymanics annual reports

Crustal heat production by radioactivity

Most of the heat escaping from the Earth’s crust originates from radioactive decay of elements concentrated in crust Energy of α, β or γ radiation is converted into the thermal movement of atoms Principal heat-producing isotopes are:

232Th α decay, half life 14Ga (109 years) 238U

α decay, half life 4.5Ga

40K

β decay, half life 0.7Ga HHP GRANITES K, U & Th concentrate in granites Occasionally A>5, then known as high heat producing granites (HHP). HHPs generate around 10 mW of heat per cubic metre

  • f rock continuously for billions of years.

A = heat production from radioactive decay (µWm-3) A = 0.1326ρ ρ (0.718U + 0.193Th + 0.262K) where ρ is density in g cm-3, U (uranium) & Th (thorium) in mg kg-1, K (potassium) in element weight % NOTE high weighting for U

http://outreach.atnf.csiro.au/education/senior/cosmicengine/sun_nuclear.html

slide-3
SLIDE 3

Generalised models of geothermal energy in granite

artificial stimulation of fractures to increase porosity and permeability EGS REQUIREMENTS

HHP GRANITE SOURCE ROCK Typically A>4 over several km thickness EXTENDED TIME Small increments of heat accumulate to create a large thermal resource THICK COVER Ideally cover is a sedimentary basin 3-4km thick with some low thermal conductivity rocks such as coal STRESS SYSTEM Favourable for stimulation in creating reservoir and connectivity between injection and production wells

UK Potential for Hot Rock Geothermal

1986 report on UK geothermal potential Identified three regions of greatest potential for high enthalpy - all associated with regions of granite 1: Cornwall 2: N.England 3: Eastern Grampian Highlands of Scotland

Granite exposure Granite concealed

C

  • r

n u b i a n b a t h

  • l

i t h Eastern Grampian batholith Northern England batholith

Cairngorm Ballater Bennachie Mount Battock

Heat generation at surface A0 (µW/m3) Heat flow at surface q0 (mW/m2) T5km (°C) E Grampians 6.5 69 93 N England 4.1 85 130 Cornubia 4.6 117 184

Magnitude of heat flow difference N-S across the UK is ~50 mWm-2 Difficult to explain such magnitude if all granites are highly radiothermal and all in the form of batholithic structures

slide-4
SLIDE 4

Variation in heat flow

Steady state heat flow and temperature at crustal depths are related to rock parameters:

In a uniform upper crust q0 is a function of D, A, λ & q* Explanations for q0 deficiency include

  • D: Granite forms thin sheets in Scotland, batholiths

in England

  • A: U & Th are largely concentrated in the surface

rocks of Scotland, etc. whereas uniform in England

  • q*: Scotland & England have different basements

with contrasting heat flow from mantle & lower crust

SYMBOLS A heat production (µW/m3) - λ thermal conductivity (Wm-1K-1), varies with T and z D thickness (km) of upper crustal unit T temperature (°C) t time (s) z depth (m) q heat flow (mW/m2) a’ and b’ are constants MODEL ASSUMPTIONS All heat transfer is by conduction Thick upper crustal layer with uniform A and λ (at reference T) q, A and λ measured at surface or in boreholes reflect crustal section

UPPER CRUST MANTLE & LOWER CRUST D

q* - background heat flow from mantle and lower crust (used only when A0 is assumed to decline exponen- tially through the upper crust) q0 - surface heat flow measured in shallow boreholes A0 - heat production in surface rocks from radioactivity, extrapolated to depth λ0 - themal conductivity of surface rocks, corrected for temperaure with depth

z

Possible differences in batholithic form?

Bouguer gravity anomaly map

Strong negative gravity anomalies over all three hot granite regions indicates batholith structures, each modelled to be >12 km deep No evidence for shallow sheets in Grampians

from Downing & Gray (1986)

slide-5
SLIDE 5

Alternative explanation for the N-S divide in heat flow

D and q* cannot explain all 50 mW/m2 difference in q0 Decline in A with depth (less U & Th) is possible but no independent evidence, in fact E.Grampians is also a radon province. Seek another factor that might have a major influence on q0 (geothermal gradient) Scotland was heavily glaciated in the Pleistocene Could geothermal gradients measured today be transient effects related to Pleistocene-Holocene warming (PHW)? Not a new idea, but estimates ~5-10mW/m2, order of magnitude lower than the 50 mW/m2 required, thus largely ignored in earlier models

http://travel.webshots.com/photo/2812073420049549203YvXeAz http://www.flickr.com/photos/niallcorbet/3742780605/

Geographical variation of flow in Europe

Spatial correlation between low heat flow and areas covered by ice during the Pleistocene

from Majorowicz & Wybraniec (2009) Ice sheet map from http://higheredbcs.wiley.com/legacy/college/levin/0471697435/chap_tut/chaps/chapter15-05.html

slide-6
SLIDE 6

North America Heat Flow – Ice Cover Correlation

Geothermal map of N.America (Blackwell & Richardson 2004) Pleistocene ice cover of N.America

(from Blakey, Univ.Nebraska)

http://smu.edu/geothermal/2004NAMap/2004NAmap.htm

Ice sheet thickness – heat flow relationships

1200 1000 1000 600 400 400 400 200 200

Ice thickness contours from Lambeck (1995) based on models of glacial rebound Model heat flow from multiple regression using ice sheet thickness and heat generation as independent variables

slide-7
SLIDE 7

Modelling step changes in climate on geothermal gradients

Combining the standard one dimensional steady state heat flow equation for upper crustal temperatures with the step function that models temperature variation with time & depth changes following a step change in surface temperature, we get

ADDITIONAL SYMBOLS ΔTs Step change in temperature (°C) t time (s)

  • UPPER CRUST

MANTLE & LOWER CRUST D

q* as before Ts - ground surface temperature T0

s

T1

s

q0 ,A0 , and λ0 as before

t1 t2 t0 COLDER WARMER WARMER z

ΔTs

T0

s

T1

s

temperature depth conceptual model t1 t2 t3 t0

Model implications

50 100

temperature (°C)

1 2 3 4 5

depth (km) t0 t0.1ka t1 t1ka t5ka t12ka

  • 10

10 20 30

temperature (°C)

0.5 1

depth (km)

t0

t1ka t5ka t1 t0.1ka t12ka

UPPER CRUST MANTLE & LOWER CRUST 15km

ΔTs = 16°C 110ka 12ka 0ka

ATMOSPHERE/ CRYOSPHERE

time (ka BP) +8°C +8°C

  • 8°C

q0 = 80 mW/m2 A0 = 5 μW/m3 λ0 = 3.5 W/mK q* = 30 mW/m2

PHW

slide-8
SLIDE 8

1 2 3

depth (km) temperature (°C) Udryn Czeszewo

based on Mottaghy et al. (2010)

20 40 60 80 100

modelled

  • bserved

q0=37.2 mW/m2 PHW -10 +8°C (T=18°C) q0=81.5 mW/m2 PHW 0 +10°C (T=10°C)

Tz logs of Polish deep boreholes

PHW: Pleistocene- Holocene Warming

Deep boreholes in sub-ice sheet terrain

Until recently the Pleistocene-Holocene Warming (PHW) assumed to have a low amplitude (ΔTs=2-8°C). More recently PHW ΔTs suggested to be very much larger (Demezhko et al. 2007, Clim.Past Discuss. 3, 607)

Udryn Czeszewo

In Poland q0 has been estimated from deep boreholes.

  • Udryn indicates ΔTs ~18°. This combined with low

q0 (37 mW/m2) leads to reversal in the normal geothermal gradient in the top half kilometre of crust

  • Czeszewo has much higher q0 (81 mW/m2)

indicating ΔTs ~10° and a more “normal” geothermal gradient

ΔTs (after Demezkho et al.

  • Clim. Past, 3, 559–568, 2007)

http://web.me.com/uriarte/Earths_Climate/

Application to the E.Grampian batholith, Scotland

Cooper Basin

slide-9
SLIDE 9

Geochemical characteristics of Scottish Granites

HHP granites are mainly those of the E Grampians (=Cairngorm suite) They are chemically very characteristic (potassic and highly evolved as indicated by high Rb/Sr). Indicate with A- or highly fractionated I-type granites.

1 2 3

K2O/Na2O

5 10

Heat production (μW/m3)

Cairngorm suite Argyll suite E.Moine suite Great Glen suite S Uplands suite .01 .1 1 10 100

Rb/Sr

Application to the E.Grampian batholith

APPLICATION OF MODEL Average values for Grampian batholith measured at/near surface: q0=72 mW/m2 D=15km, λ0=3.34 W/mK, ΔTs=12°C warming time=12ka Requires q0=95 mW/m2 to restore geothermal gradient T5km ~135°C (previously ~100°C)

Top 500m of borehole gives very misleading gradients until steady state reached All Grampian granite estimates will be affected Need better means of estimating the PHW steady state so that transient geotherms can be better modelled

20 40 60 80 100 120 140

Temperature (°C)

1 2 3 4 5

Depth (km)

Use observed geothermal gradient (50-300m) to calculate q0 (surface heat flow)

20 40 60 80 100 120 140

Temperature (°C)

1 2 3 4 5

Depth (km)

Use observed geothermal gradient (50-300m) to calculate q0 (surface heat flow) q0 used to model steady state geotherm and T5km. This geotherm will not have reached a steady state within 12ka of PHW, so transient

20 40 60 80 100 120 140

Temperature (°C)

1 2 3 4 5

Depth (km)

Use observed geothermal gradient (50-300m) to calculate q0 (surface heat flow) q0 used to model steady state geotherm and T5km. This geotherm will not have reached a steady state within 12ka of PHW, so transient tPHW: Use step function to calcuate steady state at PHW (-12ka) for q0 and ΔTs

20 40 60 80 100 120 140

Temperature (°C)

1 2 3 4 5

Depth (km)

Use observed geothermal gradient (50-300m) to calculate q0 (surface heat flow) q0 used to model steady state geotherm and T5km. This geotherm will not have reached a steady state within 12ka of PHW, so transient tPHW: Use step function to calcuate steady state at PHW (-12ka) for q0 and ΔTs tPHW+12: Find a value of q0 at PHW+12ka replicates the observed geothermal

  • gradient. Then project using new q0 to

steady state at 5km.

slide-10
SLIDE 10

Conclusions for Hot Rock Geothermal in Scotland

1. Glaciation prior to the Pleistocene-Holocene Warming period had a major impact on geothermal gradients 2. These have still not recovered to steady state, all mainland Scotland shallow geotherms are transient 3. Predictions based on shallow (<2km) boreholes are probably unreliable in high latitudes 4. Consequently, geothermal energy potential at high latitudes in the N.Hemisphere, especially in areas covered by ice sheets, has probably been greatly under-estimated 5. In the UK, a subset of Scotland’s granites (Cairngorm suite) may have excellent potential while previously rejected from consideration 6. More deep (>2km) boreholes are required and more accurate methods of modelling transient geothermal gradients

Potential EGS-hosting basins in Scotland

BASINS & BASEMENT 1. Midland Valley: Devonian-Carboniferous underlain by Lower Palaeozoic low grade rocks and crystalline basement 2. Orcadian Basin: Devonian underlain by Moine crystalline basement intruded by Caledonian granites 3. Inner Moray Firth: Mesozoic-Tertiary on earlier Devonian basin underlain by crystalline basement

ORCADIAN BASIN Devonian Archaen basement Proterozoic basement Late Proterozoic- Early Palaeozoic basement Lr Palaeozoic basement 100km

AQUIFER TARGETS Midland Valley most attractive as close to major population density Best aquifers are probably Upper Devonian and lowermost Carboniferous sandstones Permian & Mesozoic aquifers do not appear to reach adequate depths onshore for geothermal exploitation Base map from BGS

slide-11
SLIDE 11

Forth Valley Structures

Upper Coal Measures Middle Coal Measures Lower Coal Measures Passage Formation Lower Limestone Formation Pittenweem Formation Strathclyde Group (undivided) Inverclyde Group and older Limestone Coal Formation Sandy Craig Formation Pathhead Formation

0.250 0.500 0.750 1.000 1.250 1.500 1.750 2.000 2.250 2.500 2.750 3.000 WSW ENE

98002055

TWTT(secs)

2 kilometres Upper Limestone Formation

Crossing seismic line Fig. 8

From Underhill et al.

  • 2008. J.Mar.Petrol.Geol.

25, 1000

Areas of Potential Geothermal-Petroleum Synergies

  • Basin modelling in search of hot sedimentary aquifers

in the Midland Valley

  • Use of geophysics to identify targets including aquifers

and granites hidden in basement

  • Improved modelling of transient geothermal gradients
  • Reflectance, organic geochemistry etc. in seeking

palaeogeothermal gradients to improve targeting

  • Improved drilling technologies, especially for drilling

granites

  • Development of stimulation methods in granites &

sedimentary rocks

  • Co-ordinated approach to maximise return from
  • nshore drilling etc. to geothermal, conventional

hydrocarbon, CBM, CCS studies in basins such as the Midland Valley