The z=0.89 molecular absorber toward PKS1830-211: molecules as - - PowerPoint PPT Presentation

the z 0 89 molecular absorber toward pks1830 211
SMART_READER_LITE
LIVE PREVIEW

The z=0.89 molecular absorber toward PKS1830-211: molecules as - - PowerPoint PPT Presentation

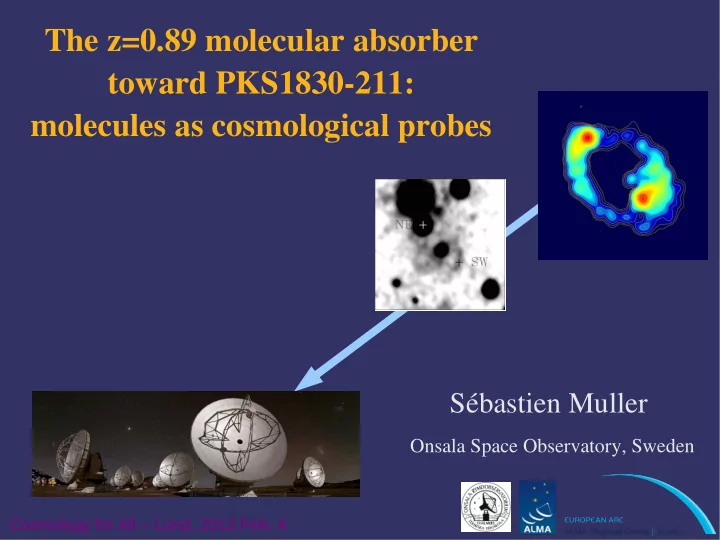
The z=0.89 molecular absorber toward PKS1830-211: molecules as cosmological probes Sbastien Muller Onsala Space Observatory, Sweden Cosmology for All Lund, 2013 Feb. 4 Interests of molecular absorption studies at z>0 - Chemical


slide-1
SLIDE 1

The z=0.89 molecular absorber toward PKS1830-211: molecules as cosmological probes

Sébastien Muller

Onsala Space Observatory, Sweden

Cosmology for All – Lund, 2013 Feb. 4

slide-2
SLIDE 2
  • Chemical inventory and gas properties in distant galaxies
  • No distance dilution
  • Spatial resolution (continuum illumination ~ few mas)

Interests of molecular absorption studies at z>0 As cosmological probes

  • CMB temperature as a function of redshift
  • Test of variations of fundamental constants (α, μ=mp/me)
  • H0
  • Chemical enrichment of the Universe (isotopic ratios)
slide-3
SLIDE 3

Source z(abs) Background continuum flux (Jy @3mm) N(H2) (cm-2) Molecules detected Cen A 0.002 6 2 x 10²⁰

CO, OH, NH3, CN, HCO+, HCN, N2H+, CS, H2CO, C3H2

3C293 0.045 2 x 10¹⁹

CO, HCO+, HCN

4C31.04 0.060 1 x 10¹⁹

CO, HCO+, HCN

PKS 1413+135 0.247 0.5 5 x 10²⁰

CO, CN, HCO+, HCN, HNC

B 1504+377 0.673 0.4 5 x 10²⁰

CO, HCO+, HCN, HNC

B 0218+357 0.685 0.5 lensed 4 x 10²¹

CO, NH3, H20, HCO+, HCN, HNC, CS, H2S, H2CO

PKS 0132-097 0.765 0.4

OH (only)

PKS 1830-211 0.886 2-3 lensed 2 x 10²² > 40 ! species (not incl. isotopic variants)

Extragalactic radio-mm molecular absorbers

e.g. see review by Combes 2008

slide-4
SLIDE 4

PKS1830-211 is the most notable radio molecular absorber at z>0

Of the only 5 distant radio molecular absorbers known to date (0.24 < z < 0.89) PKS1830-211 has:

  • highest redshift: z=0.89
  • brightest mm continuum
  • largest amount of absorbing material
  • gravitational lens
  • molecular absorption toward the SW and NE

images of the quasar

  • time variations (continuum & molecular profile)
slide-5
SLIDE 5

PKS1830-211

Foreground z=0.19 galaxy Lensed images

  • f the quasar

z=0.89 absorber HST, Courbin et al

slide-6
SLIDE 6

Unbiased ATCA-7mm spectral survey

  • Frequency coverage 30 - 50 GHz with ATCA
  • 28 species + 8 isotopic variants detected toward the SW LOS
  • Molecular abundances similar to that of Galactic diffuse/translucent clouds

Universality of chemistry !

  • Excitation mostly coupled with the CMB photons
  • Additional velocity components at -300, -225, and +170 km/s (unknown origin)

Muller et al 2011

slide-7
SLIDE 7

ALMA Early Science (Cycle 0) data

APEX - Menten et al 2008

The ground-state transition of ortho-water:

  • > Deepest absorption of all observed lines
  • > Heavy saturation toward SW LOS
  • > Multiple velocity components toward both LOS
  • > Absorption spanning a large velocity range

Muller et al in prep

H2O

slide-8
SLIDE 8

ALMA: Main absorption along the SW LOS

Saturated Optically thick Optically thin

slide-9
SLIDE 9

ALMA: Absorption along the NE LOS

  • Multiple velocity

components

  • Large velocity span
  • Similarity of H2O and

HCO+ profiles

  • Optically thin lines

ATCA Muller et al 2011

slide-10
SLIDE 10

1 atom 2 atoms 3 atoms 4 atoms 5 atoms 6 atoms 7 atoms H CH NH2 NH3 CH2NH CH3OH CH3NH2 C OH H2O H2CO c-C3H2 CH3CN CH3CCH CO C2H l-C3H l-C3H2 NH2CHO CH3CHO CS HCN HNCO H2CCN SiO HNC HOCO+ H2CCO NS N2H+ H2CS C4H SO HCO+ HC3N SO+ HCO HOC+ H2S H2Cl+ HCS+ C2S

Chemical inventory toward the SW LOS

42 species + 14 isotopic variants

See Muller et al 2011, 2013 + in prep

@ z=0.89 !

slide-11
SLIDE 11

ATCA 7 mm + 3 mm RADEX + Monte Carlo Markov Chains Best fit to the data:

TCMB = 5.08 ± 0.10 K (68%)

Tkin ~ 80 K n(H2) ~ 1000 - 2000 cm-3 Muller et al 2013

Multi-transition excitation analysis

slide-12
SLIDE 12

TCMB = 5.08 ± 0.10 K

  • > Consistent with adiabatic expansion of the Universe:

TCMB(z) = T0 x (1+z) … = 5.14 K @z=0.89

The TCMB – redshift law

See Noterdaeme et al 2011

slide-13
SLIDE 13

Probing the cosmological variations of fundamental constants of Physics with molecules

  • Astronomical constraints toward high-z quasars cover longer time (and space) span

than laboratory measurements

  • A variation of e.g.  or µ=mp/me would introduce a shift in transition frequency

Hence a velocity offset between two lines i,j with different freq dependence in a, µ ∆Vij / c = (Kµ

i – Kµ j ) ∆µ/µ + (Kα i – Kα j ) ∆α/α

Sensitivity coefficients

  • H2: |∆Kµ| ~ 0.01
  • Inversion lines of NH3 wrt a rotational line: |∆Kµ| = 3.5

Flambaum & Kozlov 2007

  • Various lines of CH3OH have different sensitivity: Kµ = -40 to +50 Jansen et al 2011
  • CI wrt a rotational line |∆Kµ| = 1, |∆Kα| = 2
  • CH @532,536 GHz wrt a rotational line: |∆Kµ| = 0.8, |∆Kα| = 1.6

de Nijs et al 2012

  • OH conjugate lines have sensitivity to G=gp(µα2)1.85

e.g. Kanekar et al 2010

slide-14
SLIDE 14

e.g. Constraints on ∆µ/µ using molecules

Method Target

∆µ/µ

Ref. inv.NH3 vs (HCO+, HCN) B0218+357 z=0.68 < 1.8 x 10⁻⁶

Murphy et al 2008

inv.NH3 vs HC3N PKS1830-211 z=0.89 < 1.4 x 10⁻⁶

Henkel et al 2009

inv.NH3 vs (CS, H2CO) B0218+357 z=0.68 < 3.6 x 10⁻⁷

Kanekar 2011

inv.NH3 vs (average of 22 species) PKS1830-211 z=0.89 < 2.2 x 10⁻⁶

Muller et al 2011

CH3OH vs (average of 22 species) PKS1830-211 z=0.89 < 1.4 x 10⁻⁶

Muller et al 2011

CH3OH PKS1830-211 z=0.89 < 6.3 x 10⁻⁷

Ellingsen et al 2012

CH3OH PKS1830-211 z=0.89 < 3.0 x 10⁻⁷

Bagdonaite et al 2013

Issues:

  • Chemical segregation
  • > Observe self-reference (e.g. CH3OH)
  • > Statistical constraint wrt multi references
  • Excitation/opacity effects
  • Time variability of the continuum
  • > Simultaneous observation of reference
  • Change of the continuum morphology with frequency
slide-15
SLIDE 15

Time delay and H0

  • Altern. using molecules

Wiklind & Combes (1999)

SEST monitoring HCO+ J=2-1 line Time delay: 24 (-4 +5) days + Lens model (Nair et al 1993) H0 = 69 (-11 +12) km s-1 Mpc-1 (q0=0.5)

Total continuum flux NE + SW images Depth of HCO+ 2-1 line (= flux of SW image)

Time delay + lens model => geometrical measurement of H0 Need to 1) Resolve the NE-SW images, separated by 1'' 2) Disentangle the core-jet emission of the quasar ATCA 8.6 GHz Time delay = 26 (-5+4) days

(Lovell et al 1998)

slide-16
SLIDE 16

Isotopic ratios

Ratio @z=0.89 Note Earth

D/H < 7e-4

Upper limit Cosmic

2.5e-5

12C/13C

30 - ?

Difficult to measure due to opacity / fractionation effects

89

14N/15N

100 - 200

~< (Uncertainty from 12C/13C)

272

16O/18O

~100

< (Uncertainty from 12C/13C)

499

18O/17O

13 ± 3

>

5.5

28Si/29Si

7 ± 0.5

(preliminary)

<

22

29Si/30Si

1.9 ± 0.3

(preliminary)

~

1.5

32S/34S

10.5 ± 0.5

<

22.5

35Cl/37Cl

~3

~

3.1

slide-17
SLIDE 17
  • PKS1830-211 is a unique target for molecular absorption studies
  • > Basic gas properties and interstellar chemistry

in the disk of a z=0.89 galaxy

  • Molecules as cosmological probes:
  • > Evolution of the CMB temperature with z
  • > Variations of fundamental constants
  • > H0
  • > Isotopic ratios and nucleosynthesis constraints
  • Unfortunately, only a handful of known z>0 mm-radio absorbers

Need to find more !

Summary

slide-18
SLIDE 18