
SLIDE 1
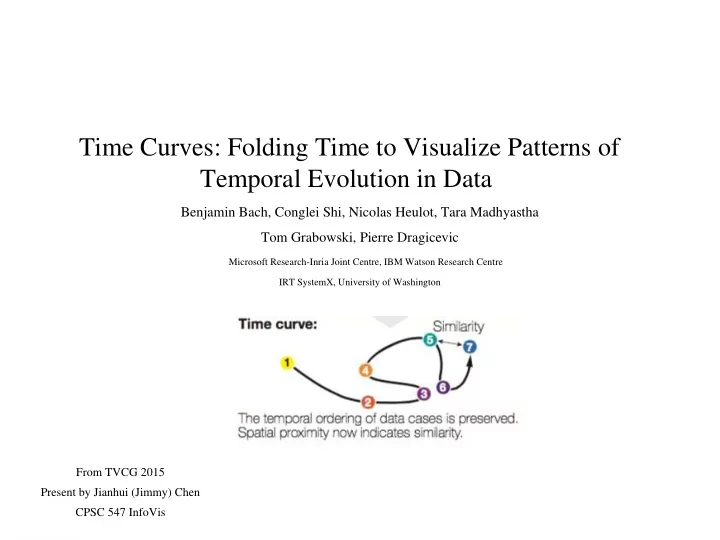
Time Curves: Folding Time to Visualize Patterns of Temporal Evolution in Data
Benjamin Bach, Conglei Shi, Nicolas Heulot, Tara Madhyastha Tom Grabowski, Pierre Dragicevic
Microsoft Research-Inria Joint Centre, IBM Watson Research Centre IRT SystemX, University of Washington
From TVCG 2015 Present by Jianhui (Jimmy) Chen CPSC 547 InfoVis