To describe the current state of the pharmacy workforce - - PDF document

to describe the current state of the pharmacy workforce
SMART_READER_LITE
LIVE PREVIEW

To describe the current state of the pharmacy workforce - - PDF document

9/30/15 ObjecFves To describe the current state of the pharmacy workforce To compare the factors that determine supply versus The Current


slide-1
SLIDE 1

9/30/15 ¡ 1 ¡

¡

¡ ¡

The ¡Current ¡and ¡Future ¡State ¡of ¡ the ¡ Pharmacy ¡Work ¡Force ¡

¡ ¡ Hannah ¡K. ¡Vanderpool, ¡Pharm.D., ¡M.A. ¡ Vice ¡President, ¡Office ¡of ¡Member ¡RelaFons ¡

ObjecFves ¡

  • To ¡describe ¡the ¡current ¡state ¡of ¡the ¡pharmacy ¡workforce ¡
  • To ¡compare ¡the ¡factors ¡that ¡determine ¡supply ¡versus ¡

demand ¡

  • To ¡forecast ¡the ¡availability ¡of ¡residency ¡posiFons ¡in ¡the ¡

future ¡

  • To ¡analyze ¡potenFal ¡implicaFons ¡for ¡NMSHP ¡and ¡ASHP. ¡

Na*onal ¡Pharmacist ¡ Workforce ¡Survey ¡2014 ¡

Pharmacy ¡Workforce ¡Center, ¡Inc. ¡

  • American ¡AssociaFon ¡of ¡

Colleges ¡of ¡Pharmacy ¡(AACP) ¡

  • American ¡College ¡of ¡Clinical ¡

Pharmacy ¡(ACCP) ¡

  • American ¡Pharmacists ¡

AssociaFon ¡(APhA) ¡

  • American ¡Society ¡of ¡Health-­‑

System ¡Pharmacists ¡(ASHP) ¡

  • Board ¡of ¡Pharmacy ¡SpecialFes ¡

(BPS) ¡

  • Bureau ¡of ¡Health ¡Professions ¡

(BHPr) ¡

  • NaFonal ¡Alliance ¡of ¡State ¡

Pharmacy ¡AssociaFons ¡ ¡ (NASPA) ¡ ¡

  • NaFonal ¡AssociaFon ¡of ¡Boards ¡
  • f ¡Pharmacy ¡(NABP) ¡
  • NaFonal ¡AssociaFon ¡of ¡Chain ¡

Drug ¡Stores ¡(NACDS) ¡ FoundaFon ¡

  • NaFonal ¡Community ¡

Pharmacists ¡AssociaFon ¡ (NCPA) ¡

  • Pharmacy ¡Technician ¡

CerFficaFon ¡Board ¡(PTCB) ¡

¡ ¡

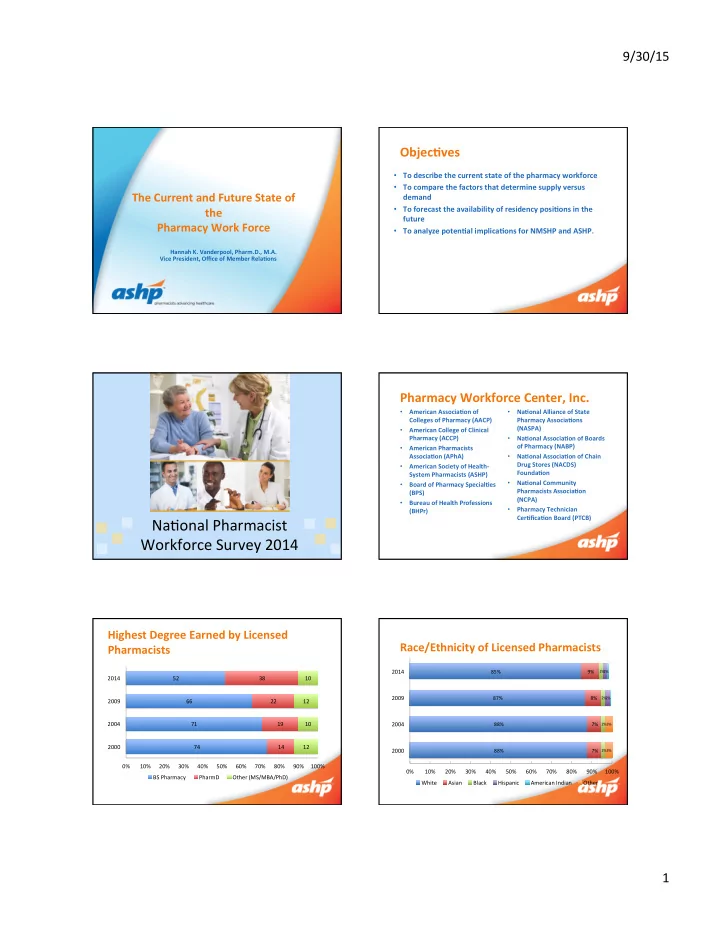
Highest ¡Degree ¡Earned ¡by ¡Licensed ¡ ¡ Pharmacists ¡

74 ¡ 71 ¡ 66 ¡ 52 ¡ 14 ¡ 19 ¡ 22 ¡ 38 ¡ 12 ¡ 10 ¡ 12 ¡ 10 ¡ 0% ¡ 10% ¡ 20% ¡ 30% ¡ 40% ¡ 50% ¡ 60% ¡ 70% ¡ 80% ¡ 90% ¡ 100% ¡ 2000 ¡ 2004 ¡ 2009 ¡ 2014 ¡ BS ¡Pharmacy ¡ PharmD ¡ Other ¡(MS/MBA/PhD) ¡

Race/Ethnicity ¡of ¡Licensed ¡Pharmacists ¡

88% ¡ 88% ¡ 87% ¡ 85% ¡ 7% ¡ 7% ¡ 8% ¡ 9% ¡

2% ¡ 2% ¡ 2% ¡ 2% ¡ 2% ¡ 2% ¡ 3% ¡ 3% ¡

0% ¡ 10% ¡ 20% ¡ 30% ¡ 40% ¡ 50% ¡ 60% ¡ 70% ¡ 80% ¡ 90% ¡ 100% ¡ 2000 ¡ 2004 ¡ 2009 ¡ 2014 ¡ White ¡ Asian ¡ Black ¡ Hispanic ¡ American ¡Indian ¡ Other ¡

slide-2
SLIDE 2

9/30/15 ¡ 2 ¡

Percent ¡of ¡AcFvely ¡PracFcing ¡Pharmacists ¡ that ¡are ¡Female: ¡ ¡1990-­‑2014 ¡ ¡

0.0% 10.0% 20.0% 30.0% 40.0% 50.0% 60.0%

1990 2000 2004 2009 2014

31. 31.3% 3% 44. 44.8% 8% 45. 45.9% 9% 46. 46.4% 4% 57. 57.1% 1%

Mean ¡Full-­‑Time ¡Equivalent ¡(FTE) ¡ ContribuFons ¡by ¡Age ¡& ¡Gender ¡ ¡

1.03 1.03 0.98 1.1 1.04 1.01 1.00 0.88 0.62 0.61 0.99 1.00 0.96 0.9 0.9 0.98 0.85 0.87 0.69 0.44 0.2 0.4 0.6 0.8 1 1.2 <30 31-35 36-40 41-45 46-50 51-55 56-60 61-65 66-70 >70

Males Females

2009 ¡ Females: ¡0.82 ¡ ¡ ¡ ¡ ¡Males: ¡0.92 ¡ 2014 ¡ Females: ¡0.93 ¡ ¡ ¡ ¡ ¡Males: ¡0.95 ¡

PracFce ¡Sebngs ¡

Community: ¡Independent, ¡Chain, ¡Mass ¡Merchandiser, ¡Supermarket ¡ ¡ Hospital: ¡In-­‑paFent ¡or ¡out-­‑paFent ¡hospital ¡sebngs ¡ ¡ Other ¡PaFent ¡Care ¡Sebngs: ¡long ¡term ¡care, ¡nuclear, ¡clinic-­‑based, ¡ ¡central ¡ fill, ¡home ¡health/infusion, ¡and ¡specialty ¡pharmacies ¡ ¡ Other ¡Non-­‑PaFent ¡Care ¡Sebngs: ¡pharmacy ¡benefit ¡administraFon, ¡ academic, ¡government ¡administraFon, ¡pharmaceuFcal ¡industry, ¡consulFng, ¡ professional ¡associaFons, ¡and ¡other ¡organizaFons ¡that ¡were ¡not ¡licensed ¡as ¡ a ¡pharmacy ¡

PracFce ¡Sebng ¡shics: ¡ ¡ 2009 ¡vs. ¡2014 ¡

54% ¡ 27% ¡ 10% ¡ 9% ¡ 44% ¡ 30% ¡ 16% ¡ 10% ¡ 0% ¡ 10% ¡ 20% ¡ 30% ¡ 40% ¡ 50% ¡ 60% ¡ Community ¡ Hospital ¡ Other, ¡Pa*ent ¡ Care ¡SeQng ¡ Other, ¡Non-­‑ Pa*ent ¡Care ¡ SeQng ¡

2009 ¡ 2014 ¡

RaFngs ¡of ¡Workload ¡as ¡High ¡or ¡Excessively ¡ High* ¡by ¡Work ¡Sebng: ¡2004, ¡2009 ¡& ¡2014 ¡

63%

0% 10% 20% 30% 40% 50% 60% 70% 80% 90%

Indep Chain MM Super Hosp OPC Other Overall

2004 2009 2014

* ¡High ¡is ¡a ¡summated ¡score ¡of ¡five ¡items ¡(1 ¡= ¡ strongly ¡disagree ¡to ¡5 ¡= ¡strongly ¡agree) ¡> ¡ midpoint ¡(15) ¡

Pharmacists ¡with ¡High ¡Job ¡SaFsfacFon ¡ ¡ by ¡PracFce ¡Sebng: ¡2000, ¡2004, ¡& ¡2014 ¡

68%

0% 20% 40% 60% 80% 100%

Indep Chain MM Super Hosp OPC ONPC Overall

2000 2004 2014

slide-3
SLIDE 3

9/30/15 ¡ 3 ¡

41% 40% 25% 22% 16% 18% 12% 13% 6% 7%

0% 5% 10% 15% 20% 25% 30% 35% 40% 45% Medication Provider Medication Provider who also Provides Patient Care Other Activity Pharmacist Patient Care Provider who also Provides Medication Patient Care Provider

ProporFon ¡of ¡U.S. ¡Pharmacists ¡by ¡Segment ¡in ¡Descending ¡Size ¡ (2009 ¡data ¡in ¡lighter ¡tone ¡and ¡2014 ¡data ¡in ¡darker ¡tone)

ProporFons ¡of ¡Community ¡Pharmacists ¡in ¡U.S. ¡ Pharmacist ¡Segments ¡in ¡2009 ¡and ¡2014 ¡

60% ¡ 32% ¡ 3% ¡ 5% ¡ 0% ¡ 61% ¡ 29% ¡ 6% ¡ 4% ¡ 0% ¡ 0% ¡ 10% ¡ 20% ¡ 30% ¡ 40% ¡ 50% ¡ 60% ¡ 70% ¡ Medica*on ¡ Providers ¡ Medica*on ¡ Providers ¡ who ¡also ¡ Provide ¡ Pa*ent ¡Care ¡ Other ¡Ac*vity ¡ Pharmacists ¡ Pa*ent ¡Care ¡ Providers ¡ who ¡also ¡ Provide ¡ Medica*on ¡ Pa*ent ¡Care ¡ Providers ¡ 2009 ¡ 2014 ¡

ProporFons ¡of ¡Hospital ¡Sebng ¡Pharmacists ¡ ¡ in ¡U.S. ¡Pharmacist ¡Segments ¡in ¡2009 ¡and ¡2014 ¡

23% ¡ 24% ¡ 17% ¡ 23% ¡ 13% ¡ 23% ¡ 20% ¡ 14% ¡ 31% ¡ 12% ¡ 0% ¡ 5% ¡ 10% ¡ 15% ¡ 20% ¡ 25% ¡ 30% ¡ 35% ¡ Medica*on ¡ Providers ¡ Medica*on ¡ Providers ¡ who ¡also ¡ Provide ¡ Pa*ent ¡Care ¡ Other ¡Ac*vity ¡ Pharmacists ¡ Pa*ent ¡Care ¡ Providers ¡ who ¡also ¡ Provide ¡ Medica*on ¡ Pa*ent ¡Care ¡ Providers ¡ 2009 ¡ 2014 ¡

ProporFon ¡with ¡Residency ¡Training ¡for ¡ U.S. ¡Pharmacist ¡Segments ¡in ¡2009 ¡and ¡2014 ¡

3% ¡ 4% ¡ 19% ¡ 25% ¡ 26% ¡ 6% ¡ 5% ¡ 27% ¡ 30% ¡ 34% ¡ 0% ¡ 5% ¡ 10% ¡ 15% ¡ 20% ¡ 25% ¡ 30% ¡ 35% ¡ 40% ¡ Medica*on ¡ Providers ¡ Medica*on ¡ Providers ¡ who ¡also ¡ Provide ¡ Pa*ent ¡Care ¡ Other ¡Ac*vity ¡ Pharmacists ¡ Pa*ent ¡Care ¡ Providers ¡ who ¡also ¡ Provide ¡ Medica*on ¡ Pa*ent ¡Care ¡ Providers ¡ 2009 ¡ 2014 ¡

Workforce ¡Supply ¡vs. ¡ Demand ¡

How ¡many ¡pharmacists ¡are ¡there? ¡

  • The ¡Department ¡of ¡Labor, ¡Bureau ¡of ¡Labor ¡Sta*s*cs ¡(BLS), ¡

reports ¡that ¡in ¡2012 ¡there ¡were ¡286,400 ¡pharmacists ¡

  • BLS ¡projects ¡14% ¡growth ¡by ¡2022, ¡or ¡327,800 ¡pharmacists ¡
  • They ¡project ¡employment ¡figures, ¡not ¡supply ¡and ¡demand ¡

Bureau ¡of ¡Labor ¡Sta*s*cs, ¡U.S. ¡Department ¡of ¡Labor, ¡Occupa&onal ¡Outlook ¡Handbook, ¡ 2014-­‑15 ¡Edi&on, ¡Pharmacists, ¡on ¡the ¡Internet ¡at ¡h _p://www.bls.gov/ooh/healthcare/pharmacists.htm ¡(visited ¡April ¡24, ¡2015). ¡

slide-4
SLIDE 4

9/30/15 ¡ 4 ¡

NaFonal ¡Center ¡for ¡Health ¡Workforce ¡Analysis ¡

¡

Health ¡Workforce ¡ProjecFon: ¡Pharmacists ¡

  • Released ¡December ¡2014 ¡
  • Uses ¡HRSA ¡Health ¡Workforce ¡SimulaFon ¡Model ¡
  • Accounts ¡for ¡changes ¡in ¡supply ¡(new ¡entrants, ¡

reFrement, ¡hours ¡worked ¡palerns) ¡

  • Accounts ¡for ¡changes ¡in ¡demand ¡(ACA ¡Rx ¡coverage, ¡

populaFon ¡demographics, ¡demand ¡for ¡prescripFon ¡ medicaFons) ¡

  • Does ¡not ¡account ¡for ¡future ¡growth ¡in ¡paFent ¡care ¡

services/roles ¡of ¡pharmacists, ¡provider ¡status, ¡changes ¡in ¡ part ¡D ¡coverage ¡

EsFmated ¡Supply ¡and ¡Demand ¡for ¡Pharmacists ¡

2012-­‑2025 ¡

Source: ¡HRSA ¡Na*onal ¡Center ¡for ¡Healthcare ¡Workforce ¡Analysis ¡ ¡ ASHP ¡Surveys ¡show ¡peak ¡pharmacist ¡shortage ¡in ¡2000, ¡ ¡ with ¡decline ¡in ¡vacancy ¡rates ¡ 1 2 3 4 5 6 7 8 9

2000 2002 2004 2005 2006 2007 2008 2009 2010 2011 2012 2013 2014

8.9 7.2 5.7 6.3 5.7 6.3 5.9 3.7 2.8 2.4 2.7 2.1 2.2 Percent Vacancies

Hospital Pharmacist Vacancy Rates

Supply ¡of ¡Pharmacists: ¡ ¡Graduates ¡from ¡ US ¡Pharmacy ¡Schools: ¡ ¡1960 ¡-­‑ ¡2014 ¡

0 ¡ 2000 ¡ 4000 ¡ 6000 ¡ 8000 ¡ 10000 ¡ 12000 ¡ 14000 ¡ 16000 ¡ 1960 ¡ 1963 ¡ 1966 ¡ 1969 ¡ 1972 ¡ 1975 ¡ 1978 ¡ 1981 ¡ 1984 ¡ 1987 ¡ 1990 ¡ 1993 ¡ 1996 ¡ 1999 ¡ 2002 ¡ 2005 ¡ 2008 ¡ 2011 ¡ 2014 ¡

23 ¡

Source: ¡AACP ¡

A ¡lot ¡of ¡press ¡on ¡possible ¡surplus ¡of ¡ pharmacists ¡

slide-5
SLIDE 5

9/30/15 ¡ 5 ¡ ASHP ¡Policy ¡PosiFon ¡

1108 ¡

QUALITY ¡OF ¡PHARMACY ¡EDUCATION ¡AND ¡EXPANSION ¡OF ¡COLLEGES ¡OF ¡ PHARMACY ¡

Source: ¡Council ¡on ¡EducaFon ¡and ¡Workforce ¡Development ¡ ¡

To ¡support ¡the ¡AccreditaFon ¡Council ¡for ¡Pharmacy ¡EducaFon’s ¡conFnuing ¡role ¡of ¡ promulgaFng ¡accreditaFon ¡standards ¡and ¡guidelines ¡and ¡engaging ¡in ¡sound ¡accreditaFon ¡ processes ¡to ¡ensure ¡quality ¡in ¡the ¡educaFon ¡provided ¡by ¡colleges ¡of ¡pharmacy; ¡further, ¡ ¡ To ¡acknowledge ¡that, ¡in ¡addiFon ¡to ¡a ¡robust ¡curriculum, ¡access ¡to ¡quality ¡experienFal ¡ educaFonal ¡sites ¡and ¡the ¡availability ¡of ¡qualified ¡faculty ¡(including ¡preceptors ¡and ¡ specialty-­‑trained ¡clinical ¡faculty) ¡are ¡essenFal ¡determinants ¡of ¡the ¡ability ¡to ¡expand ¡ enrollment ¡in ¡exisFng ¡or ¡addiFonal ¡colleges ¡of ¡pharmacy; ¡further, ¡ ¡ To ¡oppose ¡expansion ¡of ¡enrollment ¡in ¡exisFng ¡or ¡new ¡colleges ¡of ¡pharmacy ¡unless ¡well-­‑ designed ¡projecFons ¡demonstrate ¡that ¡such ¡enrollment ¡increases ¡are ¡necessary ¡to ¡ maintain ¡a ¡viable ¡pharmacist ¡workforce. ¡

¡ ¡

Factors ¡influencing ¡the ¡“supply” ¡

  • The ¡number ¡of ¡pharmacy ¡graduates ¡
  • State ¡of ¡the ¡economy ¡ ¡

– Impact ¡on ¡the ¡number ¡of ¡pharmacists ¡re*ring ¡ – Impact ¡on ¡part ¡*me ¡to ¡full ¡*me ¡shib ¡

  • The ¡gender ¡mix ¡(slowly ¡growing) ¡
  • The ¡number ¡of ¡internaFonal ¡pharmacy ¡graduates ¡

(minimal) ¡ ¡

Factors ¡influencing ¡the ¡“demand” ¡

  • The ¡demand ¡by ¡employers ¡

– State ¡of ¡the ¡economy ¡ – Prescrip*on ¡volume ¡ – NEW ¡roles ¡of ¡pharmacists ¡ – Changing ¡role ¡of ¡pharmacists ¡ – Changing ¡role ¡of ¡pharmacy ¡technicians ¡ – Impact ¡of ¡automa*on ¡and ¡technology ¡

¡ ¡ Availability ¡of ¡Pharmacy ¡ ¡ Residency ¡PosiFons ¡

200 400 600 800 1000 1200 1400 1600 1800 2000 1980 1982 1984 1986 1988 1990 1992 1994 1996 1998 2000 2002 2004 2006 2008 2010 2012 2014

ASHP Accredited Pharmacy Residency Program Growth (1980-2015) as of 1/5/15

Hospital Pharmacy Practice PGY1 Clinical Specialized PGY2

1,861 ¡

1900 ¡ 2092 ¡ 2508 ¡ 2915 ¡ 3277 ¡ 3706 ¡ 3933 ¡ 4142 ¡ 4358 ¡ 1612 ¡ 1769 ¡ 1873 ¡ 1951 ¡ 2173 ¡ 2413 ¡ 2694 ¡ 2862 ¡ 3081 ¡ 1343 ¡ 1487 ¡ 1651 ¡ 1801 ¡ 2027 ¡ 2268 ¡ 2495 ¡ 2640 ¡ 2811 ¡ 0 ¡ 500 ¡ 1000 ¡ 1500 ¡ 2000 ¡ 2500 ¡ 3000 ¡ 3500 ¡ 4000 ¡ 4500 ¡ 5000 ¡ 2007 ¡ 2008 ¡ 2009 ¡ 2010 ¡ 2011 ¡ 2012 ¡ 2013 ¡ 2014 ¡ 2015 ¡

ASHP ¡Residency ¡Matching ¡Program ¡ 2007-­‑2015 ¡ PGY1 ¡

# ¡applicants ¡ # ¡posi*ons ¡ # ¡matched ¡ 91% ¡fill ¡for ¡ all ¡PGY1 ¡

slide-6
SLIDE 6

9/30/15 ¡ 6 ¡

239 ¡ 330 ¡ 384 ¡ 483 ¡ 541 ¡ 677 ¡ 777 ¡ 917 ¡ 1002 ¡ 286 ¡ 334 ¡ 380 ¡ 439 ¡ 514 ¡ 585 ¡ 692 ¡ 792 ¡ 906 ¡ 195 ¡ 267 ¡ 297 ¡ 369 ¡ 438 ¡ 505 ¡ 601 ¡ 706 ¡ 794 ¡ 41 ¡ 81 ¡ 88 ¡ 114 ¡ 144 ¡ 179 ¡ 230 ¡ 260 ¡ 297 ¡

0 ¡ 200 ¡ 400 ¡ 600 ¡ 800 ¡ 1000 ¡ 1200 ¡

2007 ¡ 2008 ¡ 2009 ¡ 2010 ¡ 2011 ¡ 2012 ¡ 2013 ¡ 2014 ¡ 2015 ¡

ASHP ¡Residency ¡Matching ¡Program ¡ 2007-­‑2015 ¡ PGY2 ¡ ¡ ¡

# ¡applicants ¡(includes ¡ early ¡commits) ¡ # ¡posi*ons ¡(includes ¡ early ¡commits) ¡ # ¡total ¡match ¡(early ¡ commit+match) ¡ # ¡early ¡comit ¡

¡ 88% ¡fill ¡for ¡PGY2 ¡

288 ¡ 323 ¡ 635 ¡ 964 ¡ 1104 ¡ 1293 ¡ 1239 ¡ 1491 ¡ 1373 ¡

0 ¡ 200 ¡ 400 ¡ 600 ¡ 800 ¡ 1000 ¡ 1200 ¡ 1400 ¡ 1600 ¡ 1800 ¡

2007 ¡ 2008 ¡ 2009 ¡ 2010 ¡ 2011 ¡ 2012 ¡ 2013 ¡ 2014 ¡ 2015 ¡

Shortage ¡of ¡PGY1 ¡posiFons ¡-­‑ ¡based ¡on ¡match ¡parFcipants ¡and ¡ available ¡PGY1 ¡posiFons ¡

ImplicaFons ¡and ¡ Discussion ¡

ImplicaFons ¡

  • Good ¡implicaFons: ¡Workload, ¡job ¡saFsfacFon, ¡proporFon ¡of ¡

paFent ¡care ¡duFes ¡is ¡posiFve ¡for ¡our ¡members ¡ ¡

  • Challenges: ¡Ongoing ¡monitoring ¡of ¡supply ¡vs. ¡demand, ¡

advancing ¡the ¡roles ¡of ¡pharmacists ¡ ¡

What ¡can ¡ASHP ¡and ¡NMSHP ¡Do? ¡

  • ProacFvely ¡monitor ¡workforce ¡trends ¡
  • Communicate ¡implicaFons ¡with ¡members ¡
  • IdenFfy ¡and ¡move ¡forward ¡acFons ¡that ¡support ¡the ¡ASHP ¡

strategic ¡plan ¡related ¡to ¡workforce ¡trends ¡

  • Advocate ¡with ¡stakeholders ¡to ¡advance ¡pharmacy ¡pracFce ¡

¡

QuesFons/Discussion? ¡