
SLIDE 1
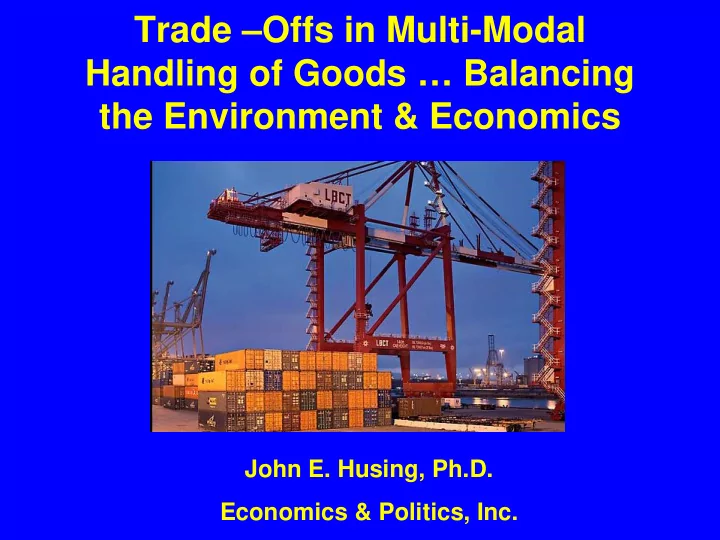
Trade –Offs in Multi-Modal Handling of Goods … Balancing the Environment & Economics
John E. Husing, Ph.D. Economics & Politics, Inc.
Trade Offs in Multi-Modal Handling of Goods Balancing the - - PowerPoint PPT Presentation
Trade Offs in Multi-Modal Handling of Goods Balancing the Environment & Economics John E. Husing, Ph.D. Economics & Politics, Inc. No Where Is The Conflict Between Economic & Environmental Goals More Stark Than In Goods
John E. Husing, Ph.D. Economics & Politics, Inc.
Source: SCAQMD, Multiple Air Toxics Exposure Study II, March 2000
Cancers per million
Los Angeles Long Beach
3.7 3.8 4.1 4.4 5.1 5.4 5.8 6.5 7.5 8.2 9.5 9.6 10.611.8 13.114.215.8 15.7 14.3 11.8 14.3 42.5 42.5 TEU=20 foot equivalent container units Source: Ports of Los Angeles & Long Beach, Forecast by Global Insights
Port Container Traffic Ports of Los Angeles & Long Beach, 1990-2009 & Long Term (million TE
2008 42.2% U.S. Imported Containers 26.9% U.S. Exported Containers
Sprawl is inevitable given demand & land availability
“Give Me A One-Armed Economist” President Harry Truman
Every Wage & Salary Job Created In California Since 1998 Has Been Lost Blue Collar Inland Empire Was Responsible for 42.3%
0.0% 1.0% 2.0% 3.0% 4.0% 5.0% 6.0% 7.0% 8.0% 9.0% 10.0% 11.0% 12.0% 13.0%
U.S. CA Source: U.S. Bureau of Labor Statistics, CA Employment Development Department
U.S. & California Unemployment History, 1983-2010
13.0%
Los Angeles
11.2% 10.6% 9.6%
Ventura San Diego Orange
Source: CA Employment Development Department
Unemployment Rates, August 2010 Inland vs. Coastal Counties
15.3% 14.2%
Riverside San Bernardino
Inland Coastal
Inland Coastal
49% 48% 45% 37% 36% 34%
Source: American Communitu Survey, 2008
Marginally Educated Adults, Southern California Percent, 25 & Over, 2008
48.0%
Los Angeles
48.1% 44.7%
San Bernardino Riverside
38.5% 34.2% 31.3%
Ventura Orange San Diego
Source: American Community Survey, 2009
Hispanic Share of Population Southern California Counties, 2009
Inland Coastal
16.6% 17.4% 16.4% 15.4% 14.8% 14.3% 13.2%
Merced San Joaquin Stanislaus Fresno San Benito Madera Tuolumne
11.7% 11.3% 11.1% 9.7% 9.1% 8.4%
Alameda Contra Cost Santa Clara San Francisc San Mateo Marin
Source: CA Employment Development Department
Unemployment Rates, August 2010 Inland vs. Coastal Counties
Inland Coastal
57.2% 54.2% 51.9% 50.7% 50.3% 50.3%
Merced Madera Stanislaus Fresno San Joaquin San Benito
34.8% 32.4% 30.7% 30.0% 28.1% 20.9%
Alameda Contra Cost Santa Clara San Mateo San Francisc Marin
Source: American Community Survey, 2009
Marginally Educated Adults, Extended Bay Area Percent 25% & Over, No College Class, 2009
Inland Coastal
53.1% 53.0% 51.7% 49.3% 40.3% 37.6%
Merced San Benito Madera Fresno Stanislaus San Joaquin
26.3% 23.7% 23.2% 21.9% 14.7% 14.4%
Santa Clara San Mateo Contra Cost Alameda Marin San Francisc
Source: American Community Survey, 2009
Hispanic Share of Population Northern California Counties, 2009
Inland Coastal
Mining ($96,996) Manufacturing ($47,933) Logistics ($46,665) Wholesale ($43,492) Median Construction ($41,453) Retail Trade ($28,840) Gaming ($28,385) Hotel/Motel ($24,019) Agriculture ($22,793) Eating & Drinking ($15,132) Blue Collar With Part Time Workers & Owner – Operator Drivers
Clean Air, Asthma & Cancer Are Health & Social Justice Issues Lack of Blue Collar Jobs & Poverty Are Health & Social Justice Issues
If We Require New Equipment … Its Time Regulators Did Something To Get It Made In California Otherwise All Investments For Environmental Clean-Up Are A Net Loss To California’s Economy
If New Equipment Is Mandated … Firms Need To Be Given Enough Time To Use It & Amortize Its Cost ... Before Being Required To Install Still Newer Equipment Otherwise We Continue Raising The Cost of Doing Business In California & Cause Firms To Either Move or Put Their Growth Elsewhere
Every Project Requires CEQA Approvals, With Lawsuits Almost Always Filed … Creation of Courts Specializing In CEQA Would Eliminate The Lengthy Delays This Imposes Judges Would Not Handle Criminal & Civil Matters & Would Become CEQA Experts. They Would Learn The Bad Actors Skirting The Law Or Using It Only to Delay Projects
CA Needs To Fully Embrace Public Private Partnerships To Finance Its Infrastructure Given Federal & State Budgets Issues, Either We Allow Our Infrastructure To Continue Deteriorating or We Harness The Private Sector To Build Needed Projects
Californians Designed Tesla & Fisker … BUT CA Costs Meant Both Would be Made Elsewhere (New Mexico & Delaware) Special Subsidies Were Used To Bring Tesla Home … Without Special Help Fisker Went To Delaware Without Out Major Changes … CA Will Create High Paying Design Jobs … and Low Paying Installation Jobs … But Few Green Production Jobs Tesla Fisker
CA Relies Heavily On Command & Control In Its Policies Using Single Issue Regulatory Agencies They Have No Mandate To Worry About the Job Impacts of Their Actions If The State Is Seriously Concerned With Job Creation … There Is A Need For An Independent Counter-Weight With The Power To Analyze, Comment and Modify Decisions
Clean Air, Asthma & Cancer Are Health & Social Justice Issues Lack of Blue Collar Jobs & Poverty Are Health & Social Justice Issues