
SLIDE 1
Ulam networks, fractal Weyl law and Anderson localization
Dima Shepelyansky (CNRS, Toulouse) www.quantware.ups-tlse.fr/dima
with L.Ermann (CNEA TANDAR), K.Frahm (LPT), V.Kandiah (LPT), H.Escaith (WTO Geneve), O.V.Zhirov (BINP Novosibirsk)
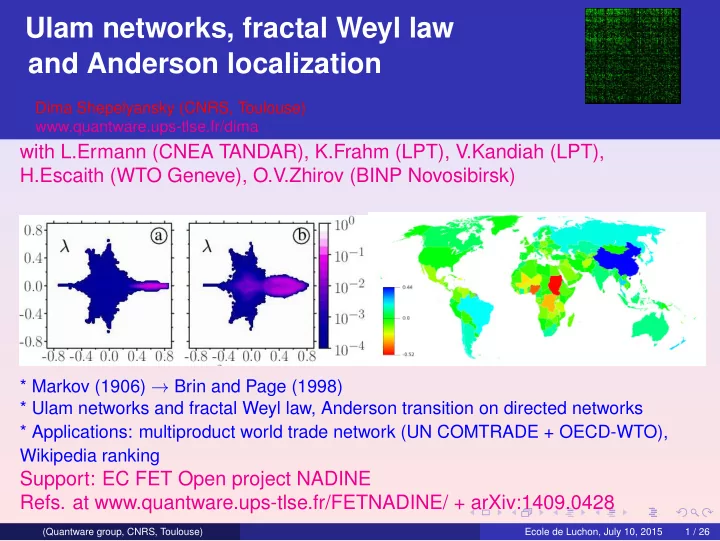
* Markov (1906) → Brin and Page (1998) * Ulam networks and fractal Weyl law, Anderson transition on directed networks * Applications: multiproduct world trade network (UN COMTRADE + OECD-WTO), Wikipedia ranking
Support: EC FET Open project NADINE
- Refs. at www.quantware.ups-tlse.fr/FETNADINE/ + arXiv:1409.0428
(Quantware group, CNRS, Toulouse) Ecole de Luchon, July 10, 2015 1 / 26