USING EYE IMAGES THE DISEASE DR is ocular manifestation of diabetes - - PowerPoint PPT Presentation

using eye images the disease
SMART_READER_LITE
LIVE PREVIEW

USING EYE IMAGES THE DISEASE DR is ocular manifestation of diabetes - - PowerPoint PPT Presentation

Source : Kaggle DIABETIC RETINOPATHY DETECTION Mohit Singh Solanki Group-14 USING EYE IMAGES THE DISEASE DR is ocular manifestation of diabetes Growth of blood vessels Retina lacks oxygen Blood vessels may bleed, cloud vision,


slide-1
SLIDE 1

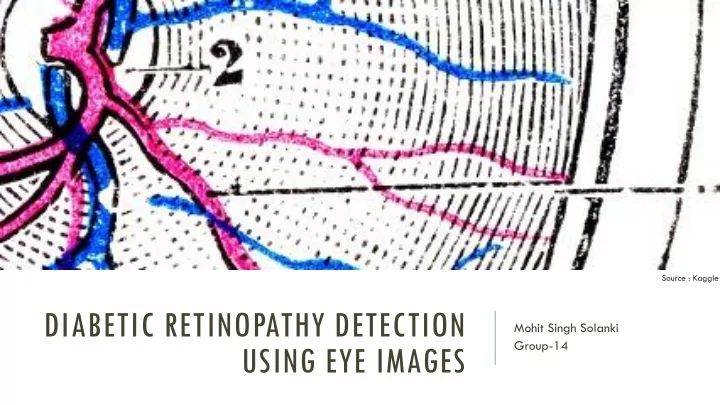
DIABETIC RETINOPATHY DETECTION USING EYE IMAGES

Mohit Singh Solanki Group-14

Source : Kaggle

slide-2
SLIDE 2

THE DISEASE

  • DR is ocular manifestation of diabetes
  • Growth of blood vessels
  • Retina lacks oxygen
  • Blood vessels may bleed, cloud vision,

may cause blindness

Source : National Eye Institute, National Institutes

  • f Health
slide-3
SLIDE 3

SOME STATS

  • 29.1 million in US and 347 in world have diabetes
  • 40-45% of patient have some level of DR
  • Affects to 80% who has 10 or more year diabetes
  • So around 150 million have DR
  • Accounts for 12% of all new cases of blindness

But things are still done manually

slide-4
SLIDE 4

THE TASK AND CHALLENGES

  • To classify a given image set as 0-4
  • Large Datasets, high resource requirement
  • Different kind of images
slide-5
SLIDE 5

DATASET

Dataset is generated by Eyepacs and Available at Kaggle. http://www.kaggle.com/c/diabetic-retinopathy-detection/data Dataset consists of-

  • ~35,000 Images with different shades different camera
  • score by trained professional.
slide-6
SLIDE 6

PREVIOUS WORK

  • Some work has been done on fundus images which varied accuracy (60-90%)
  • No work has been done with random photographs.
slide-7
SLIDE 7

METHODOLOGY

  • Image processing and texture analysis
  • Training with neural networks
slide-8
SLIDE 8

IMAGE PROCESSING AND TEXTURE ANALYSIS

  • Removed blanc space and reduced
  • Created different classes of various versions highlighting features.
slide-9
SLIDE 9

TRAINING WITH NEURAL NETWORKS

  • Implemented using Dato’s GRAPHLAB
  • Used different feature highlighting images from previous part
  • To speed up deep learning is used
slide-10
SLIDE 10

INITIAL RESULTS

Dataset used for training Dataset used for testing classification Correct classification 0 (No DR) 32 36 39 28 1 (Mild) 23 23 27 17 2 (Moderate) 21 25 23 18 3 (Severe) 12 6 3 3 4 (Proliferative DR) 2 4 2 2

slide-11
SLIDE 11

FUTURE WORK

  • Cuda can be used with NVIDIA GPU
  • Will run for larger iterations
  • Will try to apply better feature extraction techniques
slide-12
SLIDE 12

REFERENCES

  • M. Usman Akram , Shehzad Khalid , Shoab A. Khan ,” Identificatio n and clas

sification of microa neurysms for early de tection of diabeti c retinopathy”

  • Wong Li Yun, U. Rajendra Acharya, Y.V. Venkatesh , Caroline Chee ,

Lim Choo Min, E.Y.K. Ng “Identification of different stages of diabetic retinopathy using retinal optical images”

  • G G Gardner, D Keating, T H Williamson, A T Elliott “Automatic detection of diabetic

retinopathy using an artificial neural network: a screening tool”

slide-13
SLIDE 13

TOOLS USED

  • GNU parallel
  • Dato’s Graphlab
  • Numpy
slide-14
SLIDE 14

QUESTIONS AND SUGGESTIONS