
SLIDE 1
¡ ¡
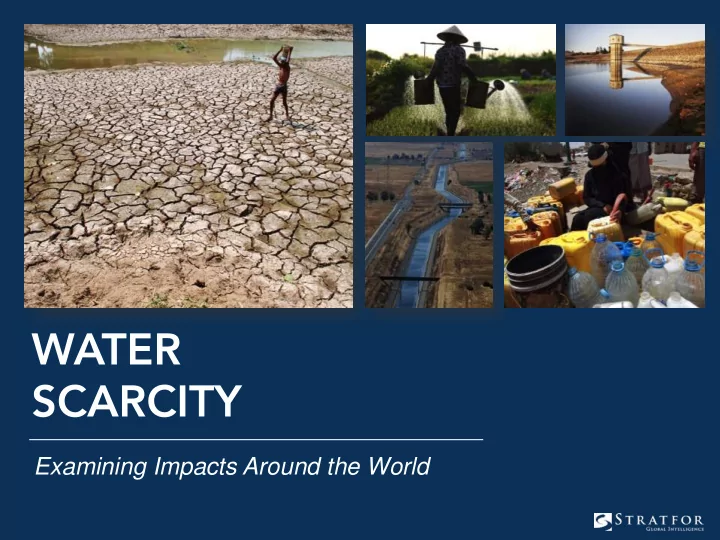
Examining Impacts Around the World
WATER SCARCITY Examining Impacts Around the World INTRODUCTION - - PowerPoint PPT Presentation
WATER SCARCITY Examining Impacts Around the World INTRODUCTION Introduction Common Issues and Impacts Case Study: Yemen Case Study: Australia Case Study: Spain Case Study: Canada 1 ABOUT
¡ ¡
Examining Impacts Around the World
¡ ¡
¡ ¡
1
¡ ¡
2
¡ ¡
series of analyses that began to appear on Stratfor.com in December 2014.
water stress and water scarcity in various parts of the world, as well as selected case studies.
end of this presentation. ¡ ¡
¡ ¡
3
Water! What is it good for?
¡ ¡
¡ ¡ To borrow a phrase from Edwin Starr: ¡ Absolutely everything! I’ll say it again … ¡
¡ ¡
4
Water! What is it good for?
¡ ¡
¡ ¡ Water is essential for:
¡
¡ ¡
5
¡ ¡
¡ ¡ It can also be:
¡ ¡
6
¡ ¡
¡ ¡ One thing water can never be:
(Cloud seeding technology still has some distance to go.) ¡
¡ ¡
7
¡ ¡
¡ ¡ Clearly, water – and more specifically, the issues of water stress and water scarcity – are key forces in geopolitics. ¡
¡ ¡
8
¡ ¡
¡ ¡ When areas are under water stress, effects can include:
production
¡ ¡
¡ ¡
9
¡ ¡
Let’s break this down a little more, by focusing on a few key concepts:
¡ ¡
¡ ¡
10
¡ ¡
movement of underground material.
year (500 m3/capita/year).
constraint on human activity. By some definitions, this amount equals less than 1,000 cubic meters per capita per year (1,000 m3/capita/ year). ¡ ¡
Many factors can influence the amount of fresh water available to communities and populations. These include, but are not limited to:
TERRAIN INFRASTRUCTURE FARMING PRACTICES GOVERNMENT PUBLIC ATTITUDES CLIMATE
¡ ¡
11
¡ ¡
¡ ¡
¡ ¡
12
¡ ¡
as mountains or rivers that can naturally supply or absorb freshwater supplies
precipitation, which can shape not only flora and fauna, but also human culture within a region
such as reservoirs, dams or aqueducts for storing and distributing water, or desalination plants to increase the amount of water available for consumption? ¡ ¡
¡ ¡
13
¡ ¡
institutions or warfare, water distribution or accessibility can be challenging issues. Where conflict exists, control of water sources is a strategic advantage.
water available for other uses. Whether irrigation or other techniques are used to raise crops, and how water is conserved or managed, also are key factors.
“common right” for the public? Or do commercial attitudes prevail, suggesting that water is more of a commodity that can be traded or sold for profit? ¡ ¡
¡ ¡
14
¡ ¡
Other factors can also have short- and long-term impacts on water
cholera, can also lead to problems with water availability and distribution
technology manufacturing and other industries can be highly water-intensive ¡ ¡
The effects of water stress and water scarcity can be felt in many ways, both immediate and long-term:
HIGHER COSTS REDUCED OUTPUTS MIGRATION POLITICAL STRESS
¡ ¡
15
¡ ¡
¡ ¡
FAMINE
¡ ¡
16
¡ ¡
slowly, and effects are felt incrementally
market shortages, increased need for imports or other logistical factors
impacted by shortages or economic pressures ¡ ¡
¡ ¡
17
¡ ¡
where jobs or agriculture are more plentiful (example: United States “Dust Bowl”)
stricken areas or in cases of severe water scarcity ¡ ¡
¡ ¡
¡ ¡
¡ ¡ ¡ ¡
18
¡ ¡
19
¡ ¡
paragon of water engineering.
times of antiquity
irrigation
intensive narcotic grown in Middle East – shot upward ¡ ¡
¡ ¡
20
¡ ¡
sources/year
¡ ¡
¡ ¡
21
¡ ¡
about 2.3% in 2014
withdrawals
water within the next decade if stay the current course ¡ ¡
¡ ¡
¡ ¡ ¡ ¡
22
¡ ¡
23
¡ ¡
within its borders.
the country.
parties.
existing water infrastructure or invest in new water sources. ¡ ¡
¡ ¡
24
¡ ¡
population
irrigation
in energy sector
become more evident
Program)
¡ ¡
¡ ¡ ¡ ¡ ¡ ¡
25
Key solutions available for Yemen: Update infrastructure Control well drilling/management Implement conservation policies Invest in/implement desalination
THEORETICALLY POSSIBLE? WITHIN GOV/ ECON MEANS?
¡ ¡
26
¡ ¡
inefficient and poorly funded
inputs):
management strategies
¡ ¡
¡ ¡
¡ ¡
¡ ¡ ¡ ¡
27
¡ ¡
28
¡ ¡
¡ ¡
¡ ¡
29
¡ ¡
¡ ¡
¡ ¡
30
¡ ¡
developed countries, although is comparatively efficient
production ¡ ¡
¡ ¡
¡ ¡ ¡ ¡
31
¡ ¡
32
¡ ¡
¡ ¡
¡ ¡
33
¡ ¡
groundwater and surface water – resulting in economic, efficient and sustainable water practices for entire country
needed to level distribution
efficient usage)
¡ ¡
¡ ¡
34
¡ ¡
Favored Nation” trade status secured March 2015
¡ ¡
¡ ¡
35
¡ ¡
exports ¡ ¡
¡ ¡
¡ ¡ ¡ ¡
36
¡ ¡
37
¡ ¡
Australia ¡ ¡
¡ ¡
¡ ¡
38
¡ ¡
development
people
¡ ¡
¡ ¡
¡ ¡ ¡ ¡
39
¡ ¡
40
¡ ¡
areas
alternatives ¡ ¡
¡ ¡ ¡ ¡ ¡ ¡
41
Potential solutions available for Spain: Update/expand infrastructure Water conservation strategies Invest in global desalination
THEORETICALLY POSSIBLE? POLITICAL OR FINANCIALLY FEASIBLE?
¡ ¡
42
¡ ¡
Extremadura and Castilla-La Mancha)
¡ ¡
¡ ¡
43
¡ ¡
transporting water to crops, let alone address amounts used
infrastructure
defended
¡ ¡
¡ ¡
44
¡ ¡
with water scarcity issues
urban coastal areas
desalination market
Reutilization Association ¡ ¡
¡ ¡
45
¡ ¡
Spanish companies in regions around the world, including the Middle East and California ¡ ¡
¡ ¡
¡ ¡
46
¡ ¡
considered “water stressed”
result ¡ ¡
¡ ¡
¡ ¡ ¡ ¡
47
¡ ¡
48
¡ ¡
increase in coming decades
¡ ¡
¡ ¡
49
¡ ¡
Canada’s stresses are dwarfed by those in other regions:
¡ ¡
¡ ¡
50
¡ ¡
more than 50 years
elevations
desalination or recycling
¡ ¡
¡ ¡
51
¡ ¡
project proposed
reservoirs and other elements to redistribute water in North America
Lakes
to build
¡ ¡
¡ ¡
52
¡ ¡
same way as oil or natural gas:
from NAFTA partners?
¡ ¡
¡ ¡
53
¡ ¡
¡ ¡
¡ ¡
54
¡ ¡
debates
withdrawal and transfer of water in quantities that could damage environment
Compact, 2005
U.S. states, 2 Canadian provinces bordering Great Lakes
¡ ¡
¡ ¡
55
¡ ¡
many countries in future
path as energy exports
resources in coming years and decades ¡ ¡
15
Attribution-NoDerivs 2.0 Generic license. It has not been modified in any way.
affected by famine in Berdyansk, Ukraine,” 1922 ¡ ¡
56
¡ ¡
¡ ¡
¡ ¡
57
¡ ¡
¡ ¡ There’s more from this series available on Stratfor.com. Explore factors at work and impacts on:
And more!
¡ ¡ facebook.com /Stratfor @Stratfor linkedin.com/ company/ stratfor STRATFORvideo
www.stratfor.com 221 West 6th Street, Suite 400 Austin, TX 78701 512.744.4300 stratfor.com/contact