SLIDE 1
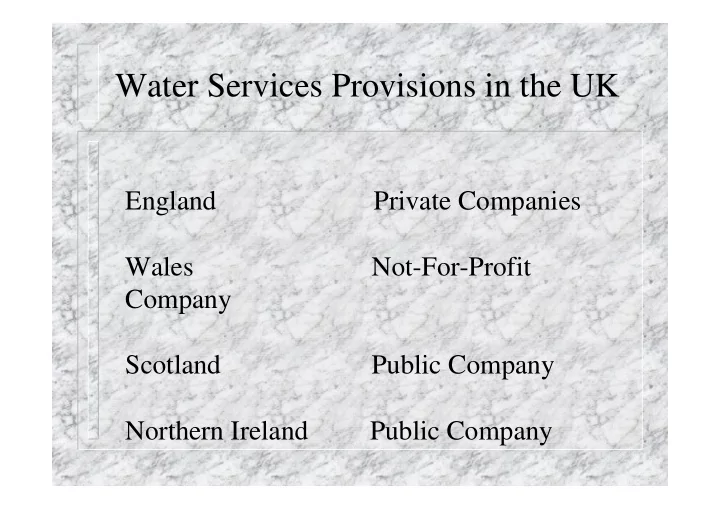
Water Services Provisions in the UK
England Private Companies Wales Not-For-Profit Company Scotland Public Company Northern Ireland Public Company
SLIDE 2
Development of Water Services 1
1970 Statutory Water Companies 33 Local Authorities 64 Joint Boards 101 Total 198 1393 Sewerage Undertakers in 1970 29 River Authorities
SLIDE 3 Development of Water Services 2
Water Act 1973 10 Regional Water Authorities Provider and Regulator Cost recovery Capital from Borrowings from
Central Government
Separate Bills for Water
Services
50% of Board Members Local
Authorities
SLIDE 4 Development of Water Services 3
Water Act 1983 Reduction in Role of Local
Authorities
Chief Executives from Private
Sector
Operation More Like Private
Companies
Could Raise Capital from
Open Market not Widely Used
SLIDE 5
Development of Water Services 4
Regional Water Authorities Limited
Success
Regulatory Functions (DSS) Weak
compared to Operations
Approximately 20% of Staff Regulatory and
80% Operation
Government Finances Under Strain
SLIDE 6 Development of Water Services 6
Water Act 1989 Privatisation of the
Water Services
Formation of the
National Rivers Authority which in 1995 became the Environment Agency
Creation of Ofwat Creation of Drinking
Water Inspectorate
SLIDE 7 Reasons for Privatisation
- Government Policy at the Time
- Large Investment Requirements
(DWD, Bathing Water Directive, proposed UWWTD)
- Freedom from Government Borrowing
(under strain at the time)
- Chief Executives from Private Sector
- Independence from Government
SLIDE 8
To Make the Companies Attractive for Privatisation
£5 Billion Debt Written Off £1.5 Billion Subsidy for Urgent
Improvements In turn
£5.225 Billion Raised from Investors £1.673 Billion Withdrawn by Labour
Government in 1997 - Windfall Tax
SLIDE 9
Structure of Water Companies in 1989
Water Holding Company Thames Plc Regulated Water Services Company Thames Water Ltd Non-Regulated Other Subsidiaries e.g Plumbing Services
SLIDE 10 Ownership of Water Services Companies
Taken over by Electricity Supplier -
Southern Water
Taken over by Private Company -
Yorkshire Water by Kelda Plc
Several Private Companies -Wessex by
Enron and Malaysian Company
Taken over by Private Company -Re-floated
- n Stock Exchange - Northumbrian Water
SLIDE 11 Example of Current Water Company Structure
Various Macquaire Funds 47.65%
Various EU,CN,AU Funds 52.35% Kemble Water Holding Ltd 100% Intermediate Holding Comp 100% Thames Water Holding 100% Thames Water PLC 100% Thames Water Services 100%
SLIDE 12
Changes to Welsh Water
Take over by Western Power USA Sold to Glas Cymru - Not-For Profit
Company Financed by Bond Issue
Operated as if Registered on Stock
Exchange but no Dividend/Profits
Customers not Liable for Losses Operations - North West Customer Services - Thames water
SLIDE 13
Water-Only Companies
Numbers Reduced from 29 to 11 through
Mergers
3 Owned by French Company Veolia 2 Owned by other Water Services
Companies
Even if Owned by Other Companies the 11
Need to be Ring-Fenced from other Activities - Ofwat - Comparative Efficiency
SLIDE 14
New Companies
Ofwat Duty to Encourage Competition Competition so far Restricted to Industrial
Supplies >50ML/d
One Company has Applied to Provide the
Water Services to a New Development.
If Approved Company would be Regulated
by Ofwat as the Other Water Companies
Total 12 WSCs and 14 WoCs
SLIDE 15 Water Services System 1
Mature System
– 99% Connected to Water Supply – 98% Connected to Sewerage System
System is Quite Old
– 50% of Sewers before 1944 – 25% of Sewers before 1918
In London 1/2 of Water Mains
>100 years and 1/3 >150 years
SLIDE 16 Water Services System 2
High Leakage
– 5112 ML/d (30%) in 1994/95 which has been
Reduced to 3291ML/d in 2008/09, a 35 % reduction
Approximately a Third of Properties have
Lead Supply and Communication Pipes
Lead Drinking Water Standard Complied
with through Water Treatment
SLIDE 17
Water Services System 3
Only 20% of Properties had Water Meters
in 2000, this has Increased to 35% in 2009
One Company Applied for Water Scarcity
Status - Compulsory Installation of Meters - 64% of Properties Currently Metered
Highest Meter Penetration - 69% Tendring
Hundred Water Company
Lowest Northumbrian Water -23%
SLIDE 18
Provision of Sewerage Services
1997 2008 Population connected to sewer % 96 98 Primary or less Treatment % 19 0.1 Secondary Treatment % 61 54.4 Tertiary Treatment % 18 44.9 Other 2 0.6
SLIDE 19 Regulatory System in E+W
Environment
Agency (EA)
Office of Water
Services (Ofwat)
Drinking Water
Inspectorate (DWI)
Water Resources Permitting+Enforcement Economic Regulations of
Water Companies
Level of Service Consumer Interests Auditing of Companies
in Meeting Drinking Water Regulations
SLIDE 20
Setting of Price Limits 1
Ofwat to Balance between Quality
Improvements and Affordability
EA and DWI Lay down Quality
Improvements Required and Desired
Ofwat Considers Impact on Water Prices In Case of Conflict Defra Gives Advice Based on Outcome Water Companies have
to Prepare Business Plans
SLIDE 21
Setting of Price Limits 2
Business Plans Contain Information on the
Investment needs and Operating Costs to Meet Quality Improvements
Ofwat Uses the Business Plans, which have
to be Prepared every 5 Years, to Assess Investment Needs, Operating Costs and Efficiency Improvements Based on the Annual “July Returns” of the Companies
This is called “Yard Stick” Regulation
SLIDE 22
Setting of Price Limits 3
Ofwat Publishes Draft Determinations of
the Price Limits
Water Companies Prepare Responses Ofwat Issues Final Determinations Right of Companies to Refer the Price
Limits to Competition Commission
Final Price Limits
SLIDE 23
Setting of Price Limits 4
Prices are based on the Performance of the
Best Group of Companies for Investment and Operating Costs
Price Limits Include a Maintenance
Allowance for Underground Assets
Depreciation for above Ground Assets
SLIDE 24 Setting of Price Limits 5
Price Limits are Set for a Basket of Charges
- Metered and Un-metered Water and
Sewage and Trade Effluent
Price limit P (%) for each company
P = RPI +K
RPI = Retail Price Index K = Price increase above RPI
SLIDE 25
Drivers For Change In Prices 2004/05 to 2009/10
Average Household Bill 2004/05 £249 Past and Future Efficiency Savings -£3/-£13 Maintaining Basic Services £18 Maintaining Security Of Supply £11 Improvement Drinking Water, Environment, Service Performance £33 Average Household Bill in 2009/10 £295 Change 2004-05 to 2009-10 £46
SLIDE 26 Drivers For Change in Bills 2004/05 to 2009/10
Maintaining Basic Services £18
- Changes in Revenue
- £6
- Changes in Operating Costs
£10
- Changes in Capital Maintenance
£7
- Changes in Impact of Taxation
£5
2
SLIDE 27 Annual Price Limit K %
05/06 06/07 07/08 08/09 09/10 Ave WSC * 9.4 4.0 3.4 2.7 2.2 4.3 WoC * 12.4 1.9 1.5 0.4
3.1 Indus try * 9.6 3.6 3.2 2.5 2.0 4.2 * Weighted Average, Ave equal Geometric Average
SLIDE 28
Setting of Price Limits 6
Price Limits Tend to be Highest in First
Year to Take into Account Any Unforeseen Price Increases during the previous Five Year Period
Interim Determinations can be Made if
there are Significant Changes i.e. If Companies have to Install more Water Meters than Predicted
SLIDE 29
Final Price Limits vs Business Plans for 2004/05-2009/10
Price Limits 05/06 06/07 07/08 08/09 09/10 AVE
BP 13.4 7.1 4.6 3.4 2.9 6.2 FD 9.6 3.9 3.2 2.5 2.0 4.2 BP – Industry Business Plans, FD – Final Determination by Ofwat
SLIDE 30 Water Prices in E+W
50 100 150 200 250 300 350 8 9 / 9 9 / 9 1 9 2 / 9 3 9 3 / 9 4 9 4 / 9 5 9 5 / 9 6 9 6 / 9 7 9 7 / 9 8 9 8 / 9 9 9 9 / / 1 1 / 2 . 2 / 3 . 3 / 4 . 4 / 5 . 5 / 6 . 6 / 7 . 7 / 8 .
SLIDE 31
Water Price Development
Water Prices Increased in Real Terms since
1989 by 42% equal to 1.8% per year
35% Households with Water Meters Rateable Value of the Property Used to
charge for Non-metered Services
Metered Charge - Standing and Volumetric
Charge
SLIDE 32
Water and Sewerage Charges in 2009-10 (£)
Metered Sewage Un- metered Sewage Metered Water Un- metered Water
Lowest 104
Thames
123
Thames
102
Northum
131
Southern
Highest 225
South W
417
South W
171
South W 280 South W
Lowest WoC Portsmouth £89/93
SLIDE 33
Investments
Since 1989 the Industry Invested £85 billion
Capital for New and the Maintenance of Existing Assets
The debts of the Companies Increased from
near Zero to £35 Billion moderating the Increase in Prices
Gearing of the Companies Increased from
near Zero in 1989 to 71% in 2008/09.
SLIDE 34
Water Mains Improvements 1999/00 to 2008/09
Water Mains Total % Relined (Km) 16 361 338051 4.8 Replaced (km) 28 245 8.2 Total Improved (km) 44 606 13 Communication Pipes Replaced (million) 1.4 24 6
SLIDE 35
Water Mains Improvements
To Prioritise Investments Water Mains
Graded in 5 Categories Depending on their Likelihood to Burst
Number of Annual Burst Mains reduced by
20% in the last 15 Years
SLIDE 36
Sewer Improvements 1999/00 to 2008/09
KM Total KM % Length Critical Sewers Improved 1 616 86851 1.9 Length of Non-Critical Sewers Improved 1604 222 225 0.35
SLIDE 37 Improvements in Level of Service from 90/91 To 08/09
Description 90/91 % 05/06 % 08/09 %
DG2 Properties at risk of low Pressure
1.85 0.02 0.03
DG3 Properties at risk of supply Interruptions >12 h
0.42 0.08 0.08 DG4 Population Subject to hosepipe bans 0.05 0.02 0.02 DG5 Properties at risk of sewer flooding once 10y
0.01
SLIDE 38 Improvements in Level of Service from 90/91 To 08/09
Description 90/91 05/06 08/09
DG5 Properties at Risk of Sewer Flooding Twice in10y
0.01
DG6 Billing Contacts not Responded with 5 wd
31.18 4.44 1.08
DG 7 Written Complaints not responded within 10 wd
31.09 3.08 0.38
DG8 Bills not Based on Meter Readings
3.67 0.52 0.21
SLIDE 39 Improvements in Level of Service from 90/91 To 08/09
Description 90/91 05/06 08/09 DG9 Telephone Calls not Answered within 10 sec 26.97
Handling
- Calls Abandoned
- All Lines Busy
- Call Handling Satisfaction
- 6.74
3.91 4.53 7.03 0.45 4.6
SLIDE 40
Payments to Customers 08/09
Number Million £
Guaranteed Standard Scheme (GSS) 78 819 4.3 Voluntary Enhanced GSS scheme 20 733 0.26 Voluntary Company Payments 57 784 2.44
SLIDE 41 Sewerage Performance
95/96 % 08/09 %
Breach of UK Consent
3 0.7
Breach of UWWTD Consent
- Unsatisfactory Sewer Overflows
29 3
Bathing Water Non- Compliance
11 3 Successful Prosecutions 39 52
SLIDE 42
Pollution Incidents in 2008
No Comment Category 1 9 Third best year since 1995 (Best 8 incidents) Category 2 46 Reduction of >30% compared to 2007 Category 3 1815 Reduction of 40% since 1995
SLIDE 43
Drinking Water Performance
Compliance with Drinking Water Standards
Increased from 99% in 1990 to 99.96% in 2008
SLIDE 44
River Water Quality Improvements
1990 % 2008 %
Chemical Good and Very Good
55 74
Chemical Very Bad
9
Biological Good and Very Good
55 72
SLIDE 45
Water Use
Unmetered 153 ltr/head/day Metered 129 ltr/head/day Average 146 ltr/head/day Water Companies have a Legal
Requirement to Improve Water Efficiency
SLIDE 46
Affordability of Water Services
Payment by Rateable Value - Poorer
Families in Cheaper Houses
Capped Tariffs >3 children, medical needs 6000 in 02/03 24 121 in 07/08 10.7% of Household > 3% of Disposal
Income
No VAT
SLIDE 47 Affordability of Water Services
Water Services Act 1999 Outlawed the
Disconnection of Water Services
4.3 Million Households in Debt vs 1.1 Million
Electricity and 0.8 Million Gas
20% of Debtors owe 70% of Debt 47% of Debtors in Highest Credit Risk 34% Rented Accommodation 23% of Debt is Leaver Debt
SLIDE 48
Household Debt (million £)
06/07 07/08 % Debt Outstanding >3 months 968 1071 11 Debt Outstanding > 10 months 599 674 12 Debt Written Off 2007/08 104 Industry Spent for Debt Recovery 2007/08 72 Impact on Household Bills £11/h
SLIDE 49
Conclusions 1
Water Industry is Highly Regulated Still Extensive Political Influence Prices have Increased significantly (46% in
real terms since 1989)
Sufficient Funds Available for Investments £85 billion Invested since 1989 £35 Billion Funded by Company Debt
SLIDE 50
Conclusions 2
Level of Leakage and Compliance with
Standards Significantly Improved
Improvements in Level of Service Non-payment of Water Bills Increasing
Problem
Competition Limited so far to Large Users
SLIDE 51 Conclusions 3
Is the System Sustainable? Already 10.7 % of
Households Paying > 3% of their Disposable Income for Water Services but only Approximately 2% of the Sewer System has been Renovated in the last 10 Years as the Emphasis has been on Water Mains Renovation?
Real Increases in Charges above Inflation will
Probably be Required for many Years to Make the Required Improvements to Underground Assets