
SLIDE 1
Mike Herchel Senior Front-end Dev at Lullabot // @mikeherchel
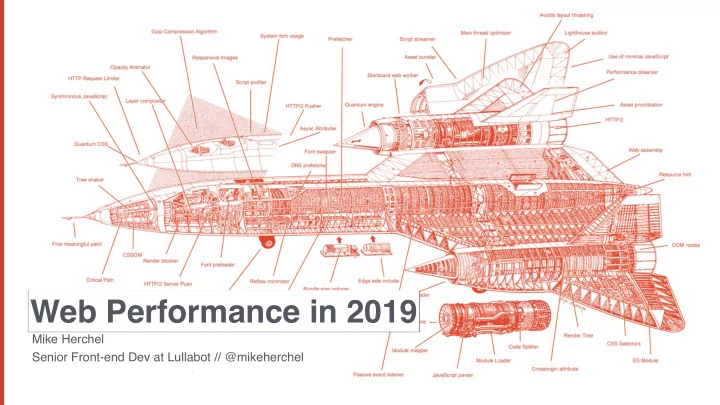
Web Performance in 2019
Web Performance in 2019 Mike Herchel Senior Front-end Dev at - - PowerPoint PPT Presentation
Web Performance in 2019 Mike Herchel Senior Front-end Dev at Lullabot // @mikeherchel WHAT TO EXPECT Why make webpages fast? What is fast? Quick rundown on how browsers work How to measure performance More in depth rundown on
Mike Herchel Senior Front-end Dev at Lullabot // @mikeherchel
Web Performance in 2019
WHAT TO EXPECT
work with tips and tricks to optimize each stage.
Mike Herchel Millie Herchel Dexter Herchel
– https://www.doubleclickbygoogle.com/articles/mobile-speed-matters/
53% of mobile site visits are abandoned if pages take longer than 3 seconds to load.
– https://www.doubleclickbygoogle.com/articles/mobile-speed-matters/
Mobile sites load in 5 seconds earn up to 2x more mobile ad revenue.
WHAT IS FAST?
FRONTEND PERFORMANCE METRICS
TIME TO FIRST BYTE
html file hits your browser.
user.
TIME TO FIRST BYTE
TIME TO FIRST MEANINGFUL PAINT
layout.
TIME TO FIRST MEANINGFUL PAINT
TIME TO INTERACTIVE
TIME TO INTERACTIVE
SPEED INDEX
https://sites.google.com/a/webpagetest.org/docs/using-webpagetest/metrics/speed-index
SPEED INDEX
https://sites.google.com/a/webpagetest.org/docs/using-webpagetest/metrics/speed-index
SPEED INDEX
HOW BROWSERS WORK: NETWORK DOWNLOAD
HOW BROWSERS WORK: PRIORITIZING CONTENT
HOW BROWSERS WORK: PARSE / EXECUTE CSS & JS
async’d or deferred before rendering layout.
(or async’d or deferred).
https://developers.google.com/web/fundamentals/performance/critical-rendering-path/constructing-the-object-model
HOW BROWSERS WORK: CREATING THE CSSOM
https://developers.google.com/web/fundamentals/performance/critical-rendering-path/constructing-the-object-model
HOW BROWSERS WORK: CREATING THE DOM
https://developers.google.com/web/fundamentals/performance/critical-rendering-path/render-tree-construction
HOW BROWSERS WORK: CREATING THE RENDER TREE
LAYOUT
(AKA REFLOW)
screen.
to other elements and the viewport.
PAINT
COMPOSITING
around
MEASURING PERFORMANCE
MEASURING PERF: DEVTOOLS AUDITS TAB
MEASURING PERF: DEVTOOLS PERFORMANCE
OPTIMIZATIONS
OPTIMIZATIONS: NETWORK DOWNLOAD
PRPL PATTERN
https://developers.google.com/web/fundamentals/performance/prpl-pattern/
OPTIMIZATIONS: NETWORK DOWNLOAD
RESOURCE HINTS
and download or connect to resources
PRELOAD IN ACTION
PRECONNECT IN ACTION
ALL TOGETHER NOW…
START USING TODAY!
PREFETCH
PREFETCHING LINKS
LINKS ENTERING VIEWPORT
OPTIMIZATIONS: NETWORK
download, which triggers another file download etc)
OPTIMIZATIONS: RENDERING
WHAT IS THE CRITICAL PATH?
rendering
CRITICAL PATH CSS
inline within a <style> tag
render document
as it finds it.
CSS OPTIMIZATIONS
delete
unused CSS (and JS).
OPTIMIZE YOUR JAVASCRIPT
JAVASCRIPT MAIN THREAD EXECUTION
https://medium.com/@addyosmani/the-cost-of-javascript-in-2018-7d8950fbb5d4
2018 JAVASCRIPT PROCESSING TIMES
OPTIMIZE YOUR JAVASCRIPT
PROFILING JAVASCRIPT
IDENTIFY 💪 3RD PARTY SCRIPTS
KEY TAKEAWAYS
(START DOING THIS TODAY!)
MAKE THE WEB A BETTER PLACE!
Don’t let proprietary solutions win!
THANK YOU!
Mike Herchel Senior Frontend Developer at Lullabot @mikeherchel