What is glutamate? O O H L Glutamic Acid L-Glutamic Acid C C - - PDF document

what is glutamate
SMART_READER_LITE
LIVE PREVIEW

What is glutamate? O O H L Glutamic Acid L-Glutamic Acid C C - - PDF document

Glutamate Content of Selected Traditional Indonesian Foods & Ingredients: Effect of Processing/Preparation Purwiyatno Hariyadi Nuri Andarwulan Lilis Nuraida Southeast Asian Food & Agricultural Science & Technology (SEAFAST)


slide-1
SLIDE 1

1

Glutamate Content of Selected Traditional Indonesian Foods & Ingredients:

Effect of Processing/Preparation

Purwiyatno Hariyadi Nuri Andarwulan Lilis Nuraida

  • Southeast Asian Food & Agricultural Science & Technology

(SEAFAST) Center dan

Presented at 43rd SEAAGS Meeting, Jakarta 4-5 August 2010

  • Professor at Department of Food Science and Technology

Faculty of Agricultural Technology INSTITUT PERTANIAN BOGOR www.ipb.ac.id

Presented at 43rd SEAAGS Meeting Jakarta 4-5 August 2010
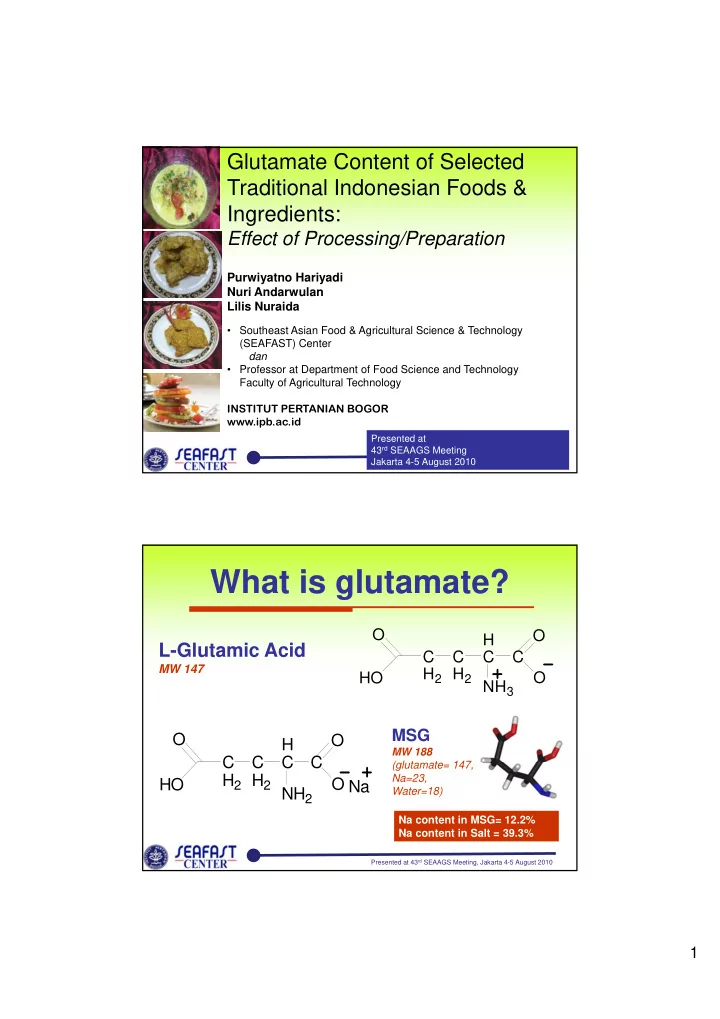
What is glutamate?

C C O H C C O

L-Glutamic Acid

C H2 C H2 HO C NH3 C O

C C O H C C O

L Glutamic Acid

MW 147

MSG

MW 188 ( l t t 147

Presented at 43rd SEAAGS Meeting, Jakarta 4-5 August 2010

C H2 C H2 HO C NH2 C O Na

Na content in MSG= 12.2% Na content in Salt = 39.3% (glutamate= 147, Na=23, Water=18)

slide-2
SLIDE 2

2

Glutamate in foods

  • Bound glutamate

(protein)

  • Free glutamate

umami taste

Presented at 43rd SEAAGS Meeting, Jakarta 4-5 August 2010

umami taste

Bound glutamate Free glutamate

Natural glutamate content of fresh food (mg/100g food) (Institute of Food Technologists, 1987)

g g

Milk/Milk products Cow 819 2 Human 229 22 Parmesan Cheese 9.847 1200 Poultry products

Presented at 43rd SEAAGS Meeting, Jakarta 4-5 August 2010

  • u t y p oducts

Eggs 1.583 23 Chicken 3.309 44 Duck 3.636 69

slide-3
SLIDE 3

3

Bound glutamate Free glutamate

Natural glutamate content of fresh food (mg/100g food) (Institute of Food Technologists, 1987)

g g Meat Beef 2.846 33 Pork 2.325 23 Fish

Presented at 43rd SEAAGS Meeting, Jakarta 4-5 August 2010

Cod 2.101 9 Mackerel 2.382 36 Salmon 2.216 20 Bound glutamate Free glutamate

Natural glutamate content of fresh food (mg/100g food) (Institute of Food Technologists, 1987)

Vegetables

Peas 5.583 200 Corn 1.765 130 Beets 256 30 Carrots 218 33 Onions 208 18

Presented at 43rd SEAAGS Meeting, Jakarta 4-5 August 2010

Onions 208 18 Spinach 289 39 Tomatoes 238 140 Green Peppers 120 32

slide-4
SLIDE 4

4

H b t “Gl t t C t t How about “Glutamate Content

  • f Selected Traditional

Indonesian Foods and Ingredients ?”

Presented at 43rd SEAAGS Meeting, Jakarta 4-5 August 2010

2 g of sample

  • 1. Extraction

ANALYSIS METHOD OF FREE L-GLUTAMIC ACID

Williams ATR and Winfield SA. 1982. Determination of Monosodium Glutamate in Food using High-performance Liquid Chromatography and Fluorescence Detection. Analyst; 107: 1092-1094

Add 20 mL H2O and mix 15 min Add 20 mL dry acetone and 5 g act. charcoal, then mix 5 min Filter through Whatman No 1, and rinse 6 times with 10 mL acetone 50%

Presented at 43rd SEAAGS Meeting, Jakarta 4-5 August 2010

Evaporate (vacuum, 70 ºC) to a volume of ± 15 mL Make up volume by deionized water in a volumetric flask of 25 mL

slide-5
SLIDE 5

5

10 µL of sample extract

  • 2. Derivatization

ANALYSIS METHOD OF FREE L-GLUTAMIC ACID

Williams ATR and Winfield SA. 1982. Determination of Monosodium Glutamate in Food using High-performance Liquid Chromatography and Fluorescence Detection. Analyst; 107: 1092-1094

Place in a 2 mL amber vial Add 50 µL buffer sodium hydrogen carbonate, pH 10.0, 4 g/L and mix Add 100 µL dansyl chloride and mix well

Presented at 43rd SEAAGS Meeting, Jakarta 4-5 August 2010

Put in waterbath 100 ºC for 10 min Filter through 0.45 µm Millipore membrane After cooled, add methanol 300 µL and mix well

  • LC model: HP Series 1100 (Hewlett Packard)

ANALYSIS METHOD OF FREE L-GLUTAMIC ACID

Williams ATR and Winfield SA. 1982. Determination of Monosodium Glutamate in Food using High-performance Liquid Chromatography and Fluorescence Detection. Analyst; 107: 1092-1094 ( )

  • Column: C18 (5 µm, 15 cm x 4.6 mm i.d.)
  • Mobile phase: 1% v/v glacial acetic acid in 45%

methanol

  • Flow rate of mobile phase: 1.1 mL/min
  • Detector: fluorescence, excitation wavelength 328 nm,

emission wavelength 530 nm

  • Sample injection volume: 20 µL
L U 3 5 F L D 1 A , Ex = 3 2 8 , E m = 5 3 0 ( B E R C A \M S G 0 0 0 0 3 .D ) 1 .4 0 7 .2 4 5

Presented at 43rd SEAAGS Meeting, Jakarta 4-5 August 2010

  • Running time: 8 min
  • Standard was injected with the same volume but

separately from sample

m in 2 .5 5 7 .5 1 0 1 2 .5 5 1 0 1 5 2 0 2 5 3 0 4 .3 9 9 5 . 9 .3 4 6
slide-6
SLIDE 6

6

Free glutamate content in condiment/seasoning in Indonesian kitchen

No Seasoning / condiment items Free glutamate content (mg/100g) low high

1 Premix seasoning : liquid, cubes and powder 6366 7077 2 Ready to use seasoning 1571 2 Ready to use seasoning 1571 3 Oyster & fish sauce 1233 4676 4 Seasoned flour 1174 5 Fermented fish/shrimp paste 978 1041 REF Oyster Souce (UMAMI Center) 900 6 Salty soybean sauce 487 7 Teriyaki & others 202 8 Tomato sauce 167 196

Presented at 43rd SEAAGS Meeting, Jakarta 4-5 August 2010 Note : n.d = not detected (less than 0.04 mg free glutamic acid/g sample)

8 Tomato sauce 167 196 9 Chili sauce 76 190 10 Sweet soy sauce 29 31 11 Dip and sauce n.d 12 Fermented soybean paste n.d 0,55 Sardines

Free glutamate content in Processed Foods in Indonesian market

Seafast Center, 2007 (Umami Center) Oyster Souce

5 5 4,99 3,04 2,8 2,07 1,26 1,04 Chips Kaki Naga and Fish Ball Fried Chicken Instant Noodle, fried Sosis and Corned Dendeng and Abon Instant Noodle, soup

Presented at 43rd SEAAGS Meeting, Jakarta 4-5 August 2010

9,78 5,5 2 4 6 8 10 12 Extrudates Chips Free Glutamate Content (mg/g)

slide-7
SLIDE 7

7

0 43 Leaf Vegetables Soup

Free glutamate content in Fruit & Vegetable Products In Indonesian Household Culinary

Seafast Center, 2007 (Umami Center) Oyster Souce

6,93 5,59 4,11 2,83 1,48 0,43 Leaf Vegetables, Stir Fry Mix All Vegetables, Stir Fry Bulb Vegetables, Stir Fry Mix All Vegetables, Soup Fruit Vegetables, Soup Leaf Vegetables, Soup

Presented at 43rd SEAAGS Meeting, Jakarta 4-5 August 2010

7,4 2 4 6 8 10 12 Sprout Vegetables, Stir Fry Free Glutamate Content (mg/g)

0 45 0,44 0,43 Glass Noodles Fried French Fries Rice Porridge

Free glutamate content in cereals and cereal products in Indonesian kitchen

Seafast Center, 2007 (Umami Center) Oyster Souce

4,75 3,35 3,13 2,68 2,56 1,68 0,92 0,45 Tofu based Noodle Wheat Flour Based, Fried Fried Rice Spaghetti Noodle Wheat Flour Based, Soup Tempeh based Traditional Cakes and Snacks Glass Noodles, Fried

Presented at 43rd SEAAGS Meeting, Jakarta 4-5 August 2010

6,74 6,51 5,64 2 4 6 8 10 12 Oncom based Mie Bakso Kuah Rice Cake with Vegetables Free Glutamate Content (mg/g)

slide-8
SLIDE 8

8

0,32 0,22 Lamb, Soup Chicken Offal, Fried, Steamed

Free glutamate content in meat and meat products (incl poultry) in Indonesian kitchen

Seafast Center, 2007 (Umami Center) Oyster Souce

2,66 2,11 2,05 1,25 1,18 0,9 0,32 Beef, Soup Chicken, Fried, Steamed Burger, Hot dog Fast Food, Meat Products Chicken, Grilled Beef, Fried, Steamed Lamb, Soup

Presented at 43rd SEAAGS Meeting, Jakarta 4-5 August 2010

3,36 2 4 6 8 10 12 Chicken, Soup p Free Glutamate Content (mg/g)

Free glutamate content in fish/egg products in Indonesian kitchen

Seafast Center, 2007 (Umami Center) Oyster Souce

3,66 3,5 3,42 2,85 0,06 Crustacean, unsalted Catch Fish, salted Catch Fish, unsalted Eggs, Spicy Aquaculture Fish

Presented at 43rd SEAAGS Meeting, Jakarta 4-5 August 2010

8,85 2 4 6 8 10 12 Eggs, Fried Free Glutamate Content (mg/g)

slide-9
SLIDE 9

9

How about the effect of Food preparation/processing?

Presented at 43rd SEAAGS Meeting, Jakarta 4-5 August 2010

  • A. Dish menu traditionally prepared with addition of MSG (only) as flavor

enhancer

  • 1. Fried tempe (Tempe goreng)
  • 2. Fried mix vegetable and wheat flour based (Bakwan sayur)

Free glutamate content in Indonesian Traditional Dishes & Effect of processing/preparation

(Seafast Center 2009)

g ( y )

  • 3. Spiced chicken soup (Soto ayam)
  • 4. Fried tofu filled with mix vegetables and wheat flour based (Tahu isi)
  • 5. Rice cake with vegetable soup in coconut milk (Lontong sayur)
  • 6. Fried soybean press cake/tofu solid waste with flour (Oncom goreng)
  • 7. Fried chicken (Ayam goreng)
  • 8. Omelet (Telur dadar)
  • B. Dish menu traditionally prepared with addition of seasoning and/or

condiment containing glutamate as flavor enhancer

  • 9. Stir fry water crest (Tumis kangkung)

10 Mixed vegetable in chicken soup (Sayur sup ayam)

Presented at 43rd SEAAGS Meeting, Jakarta 4-5 August 2010

  • 10. Mixed vegetable in chicken soup (Sayur sup ayam)
  • C. Dish menu traditionally prepared with addition of MSG, and seasoning

and/or condiment containing glutamate as flavor enhancer

  • 11. Fried rice (Nasi goreng)
  • 12. Mixed vegetables sour soup (Sayur asam)
  • 13. Meatball with noodle and vegetable in soup (Mie baso kuah)
  • 14. Chicken noodle (Mie ayam)
  • 15. Chicken rice porridge (Bubur ayam)
slide-10
SLIDE 10

10

Free glutamate content in Indonesian Traditional Dishes & Effect of processing/preparation

(Seafast Center 2009)

Presented at 43rd SEAAGS Meeting, Jakarta 4-5 August 2010

Eff t f ki

Results : Free glutamate content in Indonesian Traditional Dishes & Effect of processing/preparation

(Seafast Center 2009)

Results : A

N Dish m enu % effect of MSG added to free glutam ate content in dish m enu % effect of seasoning/ con dim ent Added to free glutam ate content in dish m enu % effect of raw m aterial to free glutam ate content in dish m enu Effect of cooking process Method % reducing/ increasing

  • f free

glutam ate content in dish m enu

A Dish m enu w ith/ w ithout addition of MSG only

Presented at 43rd SEAAGS Meeting, Jakarta 4-5 August 2010

1 Fried Tempe (tempe goreng)

1 4 2 .9

  • nd

marinat ing; frying

( -) 4 2 .9 Free glutamate content per portion/piece (33,5 g) = 25,66 mg (76,69 mg/100 g)

slide-11
SLIDE 11

11

% effect of % effect of Effect of cooking process

Free glutamate content in Indonesian Traditional Dishes & Effect of processing/preparation

(Seafast Center 2009)

Results : A

N Dish m enu % effect of MSG added to free glutam ate content in dish m enu % effect of seasoning/ con dim ent Added to free glutam ate content in dish m enu % effect of raw m aterial to free glutam ate content in dish m enu process Method % reducing/ increasing

  • f free

glutam ate content in dish m enu

A Dish m enu w ith/ w ithout addition of MSG only 2 Fried mix

8 6 .1

  • nd

frying

( + ) 1 3 .9

Presented at 43rd SEAAGS Meeting, Jakarta 4-5 August 2010

vegetable and wheat flour based (bakwan sayur)

8 6 .1 nd

y g

( + ) 1 3 .9 Free glutamate content per portion/piece (83,25 g) = 70,99 mg (85,27mg/100 g)

Effect of cooking

Free glutamate content in Indonesian Traditional Dishes & Effect of processing/preparation

(Seafast Center 2009)

Results : A

N Dish m enu % effect of MSG added to free glutam ate content in dish m enu % effect of seasoning/ con dim ent Added to free glutam ate content in dish m enu % effect of raw m aterial to free glutam ate content in dish m enu Effect of cooking process Method % reducing/ increasing

  • f free

glutam ate content in dish m enu

A Dish m enu w ith/ w ithout addition of MSG only

Presented at 43rd SEAAGS Meeting, Jakarta 4-5 August 2010

3 Spiced chicken soup (Soto ayam)

8 2 .1

  • 3 0 .7

frying; stewing

( -) 1 2 .8 Free glutamate content per serving size (249 g) = 256,67 mg (103mg/100g)

slide-12
SLIDE 12

12

% effect of % effect of Effect of cooking process

Free glutamate content in Indonesian Traditional Dishes & Effect of processing/preparation

(Seafast Center 2009)

Results : A

N Dish m enu % effect of MSG added to free glutam ate content in dish m enu % effect of seasoning/ con dim ent Added to free glutam ate content in dish m enu % effect of raw m aterial to free glutam ate content in dish m enu p Method % reducing/ increasing

  • f free

glutam ate content in dish m enu

A Dish m enu w ith/ w ithout addition of MSG only 4 Fried tofu filled

7 6 .5

  • nd

frying

( + ) 2 3 .5

Presented at 43rd SEAAGS Meeting, Jakarta 4-5 August 2010

with mix vegetable and wheat flour based (tahu isi)

7 6 .5 nd ( + ) 2 3 .5 Free glutamate content per portion/piece (52,7 g) = 115,06 mg (218,3mg/100g)

Effect of cooking

Free glutamate content in Indonesian Traditional Dishes & Effect of processing/preparation

(Seafast Center 2009)

Results : A

N Dish m enu % effect of MSG added to free glutam ate content in dish m enu % effect of seasoning/ con dim ent Added to free glutam ate content in dish m enu % effect of raw m aterial to free glutam ate content in dish m enu process Method % reducing/ increasing

  • f free

glutam ate content in dish m enu

A Dish m enu w ith/ w ithout addition of MSG only 5 Ri k ith

1 1 7 6 d

t i

( ) 1 7 6

Presented at 43rd SEAAGS Meeting, Jakarta 4-5 August 2010

5 Rice cake with vegetable soup in coconut milk (lontong sayur)

1 1 7 .6

  • nd

stewing

( -) 1 7 .6 Free glutamate content per serving size (436,75 g) = 198,81 mg (455mg/100g)

slide-13
SLIDE 13

13

Effect of cooking process

Free glutamate content in Indonesian Traditional Dishes & Effect of processing/preparation

(Seafast Center 2009)

Results : A

N Dish m enu % effect of MSG added to free glutam ate content in dish m enu % effect of seasoning/ con dim ent Added to free glutam ate content in dish m enu % effect of raw m aterial to free glutam ate content in dish m enu process Method % reducing/ increasing

  • f free

glutam ate content in dish m enu

A Dish m enu w ith/ w ithout addition of MSG only 6 Fried soybean

4 6 5 8 1 1

frying

( ) 2 7 6

Presented at 43rd SEAAGS Meeting, Jakarta 4-5 August 2010

6 Fried soybean presscake (oncom goreng)

4 6 .5

  • 8 1 .1

frying

( -) 2 7 .6 Free glutamate content per serving size (68 g) = 195,72 mg (287.8mg/100g)

Eff f ki

Free glutamate content in Indonesian Traditional Dishes & Effect of processing/preparation

(Seafast Center 2009)

Results : A

N Dish m enu % effect of MSG added to free glutam ate content in dish m enu % effect of seasoning/ con dim ent Added to free glutam ate content in dish m enu % effect of raw m aterial to free glutam ate content in dish m enu Effect of cooking process Method % reducing/ increasing

  • f free

glutam ate content in dish m enu

A Dish m enu w ith/ w ithout addition of MSG only

Presented at 43rd SEAAGS Meeting, Jakarta 4-5 August 2010

y 7 Fried chicken (ayam goreng)

3 6 .2

  • 1 5 0 .0

stewing

frying

( -) 8 6 .2 Free glutamate content per portion/piece (57,17 g) = 202,36 mg (354mg/100g)

slide-14
SLIDE 14

14

Free glutamate content in Indonesian Traditional Dishes & Effect of processing/preparation

(Seafast Center 2009)

Results : A

N Dish m enu % effect of MSG added to free glutam ate content in dish m enu % effect of seasoning/ con dim ent Added to free glutam ate content in dish m enu % effect of raw m aterial to free glutam ate content in dish m enu Effect of cooking process Method % reducing/ increasing

  • f free

glutam ate content in dish m enu

A Dish m enu w ith/ w ithout addition of MSG only

Presented at 43rd SEAAGS Meeting, Jakarta 4-5 August 2010

A Dish m enu w ith/ w ithout addition of MSG only 8 Omelet (Telur dadar)

5 6 .7

  • nd

Frying

( + ) 4 3 .3 Free glutamate content per portion (42,83 g) = 86,19 mg (201mg/100g)

Free glutamate content in Indonesian Traditional Dishes & Effect of processing/preparation

(Seafast Center 2009)

Results : B

Presented at 43rd SEAAGS Meeting, Jakarta 4-5 August 2010

slide-15
SLIDE 15

15

Effect of cooking

Free glutamate content in Indonesian Traditional Dishes & Effect of processing/preparation

(Seafast Center 2009)

Results : B

N Dish m enu % effect of MSG added to free glutam ate content in dish m enu % effect of seasoning/ con dim ent Added to free glutam ate content in dish m enu % effect of raw m aterial to free glutam ate content in dish m enu process Method % reducing/ increasing

  • f free

glutam ate content in dish m enu

B Dish m enu w ith/ w ithout addition of seasoning and/ or condim ent containing glutam ate

Presented at 43rd SEAAGS Meeting, Jakarta 4-5 August 2010

containing glutam ate 9 Stir fry water crest (tumis kangkung)

  • 1 0 0 .0

nd

stir frying

  • Free glutamate content per serving size (75 g) = 53,11 mg

(70.8mg/100g)

% effect of % effect of i / % effect of Effect of cooking process

Free glutamate content in Indonesian Traditional Dishes & Effect of processing/preparation

(Seafast Center 2009)

Results : B

N Dish m enu % effect of MSG added to free glutam ate content in dish m enu seasoning/ con dim ent Added to free glutam ate content in dish m enu raw m aterial to free glutam ate content in dish m enu Method % reducing/ increasing

  • f free

glutam ate content in dish m enu

B Dish m enu w ith/ w ithout addition of seasoning and/ or condim ent containing glutam ate

10

Mixed

9 2 5 nd

stewing

( + ) 7 5

Presented at 43rd SEAAGS Meeting, Jakarta 4-5 August 2010 10

Mixed vegetable in chicken soup (sayur sup)

  • 9 2 .5

nd

stewing

( + ) 7 .5 Free glutamate content per serving size (200 g) = 23,59 mg (11.8mg/100g)

slide-16
SLIDE 16

16

Free glutamate content in Indonesian Traditional Dishes & Effect of processing/preparation

(Seafast Center 2009)

Results : C

Presented at 43rd SEAAGS Meeting, Jakarta 4-5 August 2010

Effect of cooking

Free glutamate content in Indonesian Traditional Dishes & Effect of processing/preparation

(Seafast Center 2009)

Results : C

N Dish m enu % effect of MSG added to free glutam ate content in dish m enu % effect of seasoning/ con dim ent Added to free glutam ate content in dish m enu % effect of raw m aterial to free glutam ate content in dish m enu Effect of cooking process Method % reducing/ increasing

  • f free

glutam ate content in dish m enu

C Dish m enu w ith/ w ithout addition of MSG and/ or condim ent containing l

Presented at 43rd SEAAGS Meeting, Jakarta 4-5 August 2010

glutam ate

11

Fried rice (nasi goreng)

7 0 .5 2 9 .5 nd

frying

  • Free glutamate content per serving size (270 g) = 312,09 mg

(115,6mg/100g)

slide-17
SLIDE 17

17

% effect of % effect of i / % effect of Effect of cooking process

Free glutamate content in Indonesian Traditional Dishes & Effect of processing/preparation

(Seafast Center 2009)

Results : C

N Dish m enu % effect of MSG added to free glutam ate content in dish m enu seasoning/ con dim ent Added to free glutam ate content in dish m enu raw m aterial to free glutam ate content in dish m enu Method % reducing/ increasing

  • f free

glutam ate content in dish m enu

C Dish m enu w ith/ w ithout addition of MSG and/ or condim ent containing glutam ate

12

Mixed

6 2 2 3 7 8 nd

stewing

  • Presented at 43rd SEAAGS Meeting, Jakarta 4-5 August 2010

Mixed vegetable sour soup (sayur asam)

6 2 .2 3 7 .8 nd

stewing

Free glutamate content per serving size (200 g) = 218,49 mg (109,2mg/100g)

% effect of % effect of seasoning/ con % effect of raw Effect of cooking process %

Free glutamate content in Indonesian Traditional Dishes & Effect of processing/preparation

(Seafast Center 2009)

Results : C

N Dish m enu MSG added to free glutam ate content in dish m enu seasoning/ con dim ent Added to free glutam ate content in dish m enu raw m aterial to free glutam ate content in dish m enu Method % reducing/ increasing

  • f free

glutam ate content in dish m enu

C Dish m enu w ith/ w ithout addition of MSG and/ or condim ent containing glutam ate

13

Meat ball with

9 .8 7 .9 8 2 .3 3

portion

  • Presented at 43rd SEAAGS Meeting, Jakarta 4-5 August 2010

noodle and vegetable in soup (Mie baso kuah)

9 .8 7 .9 8 2 .3 3

p

Free glutamate content per serving size (431,8 g) = 3737,98 mg (865,7mg/100g)

slide-18
SLIDE 18

18

Free glutamate content in Indonesian Traditional Dishes & Effect of processing/preparation

(Seafast Center 2009)

Results : C

N Dish m enu % effect of MSG added to free glutam ate content in dish m enu % effect of seasoning/ con dim ent Added to free glutam ate content in dish m enu % effect of raw m aterial to free glutam ate content in dish m enu Effect of cooking process Method % reducing/ increasing

  • f free

glutam ate content in dish m enu

C Dish m enu w ith/ w ithout addition of MSG and/ or condim ent containing

Presented at 43rd SEAAGS Meeting, Jakarta 4-5 August 2010

C Dish m enu w ith/ w ithout addition of MSG and/ or condim ent containing glutam ate

14

Chicken noodle (Mie ayam)

4 7 .9 1 6 .2 3 5 .9

portion

  • Free glutamate content per serving size (221,7 g) = 306,13 mg

(138mg/100g)

% ff t f % ff t f Effect of cooking process

Free glutamate content in Indonesian Traditional Dishes & Effect of processing/preparation

(Seafast Center 2009)

Results : C

N Dish m enu % effect of MSG added to free glutam ate content in dish m enu % effect of seasoning/ con dim ent Added to free glutam ate content in dish m enu % effect of raw m aterial to free glutam ate content in dish m enu process Method % reducing/ increasing

  • f free

glutam ate content in dish m enu

C Dish m enu w ith/ w ithout addition of MSG and/ or condim ent containing glutam ate

Presented at 43rd SEAAGS Meeting, Jakarta 4-5 August 2010

15

Chicken rice porridge (Bubur ayam)

1 0 .2 5 2 .5 3 7 .3

portion

  • Free glutamate content per serving size (365 g) = 152,20 mg

(41,7mg/100g)

slide-19
SLIDE 19

19

Free glutamate content in Indonesian Traditional Dishes & Effect of processing/preparation

(Seafast Center 2009)

Results

% effect of MSG added to free glutam ate content in dish m enu % effect of seasoning/ co ndim ent Added to free glutam ate content in dish m enu % effect of raw m aterial to free glutam ate content in dish m enu Effect of cooking process % reducing/ increasing

  • f free glutam ate

content in dish m enu Min - m ax 9 .8 – 1 4 2 .9 7 .9 – 1 0 0 .0 3 0 .7 – 1 5 0 .0

( -) 1 8 .2 – ( + ) 4 3 .3

Presented at 43rd SEAAGS Meeting, Jakarta 4-5 August 2010

Free glutamate content in Indonesian Traditional Dishes & Effect of processing/preparation

(Seafast Center 2009)

Results

Free glutamate content in dish Free glutamate content in dish menu was affected by:

  • raw material and its composition,
  • the addition of MSG,
  • seasoning and/or condiments and

Presented at 43rd SEAAGS Meeting, Jakarta 4-5 August 2010

seasoning and/or condiments, and

  • cooking process.
slide-20
SLIDE 20

20

Thanks to D Lili N id Dr Lilis Nuraida Dr Nuri Andarwulan Dr Siti Madanijah Zualikah, SP Seafast center Bogor Agricultural University

Presented at 43rd SEAAGS Meeting, Jakarta 4-5 August 2010

Bogor Agricultural University Bogor, Indonesia

TERIMA KASIH

Presented at 43rd SEAAGS Meeting, Jakarta 4-5 August 2010