
SLIDE 1
1 National Grid
| [Insert document title] | [Insert date]
What is Linepack?
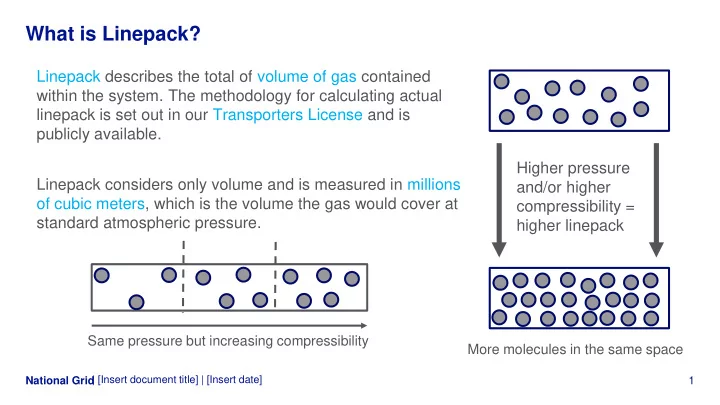
Linepack describes the total of volume of gas contained within the system. The methodology for calculating actual linepack is set out in our Transporters License and is publicly available. Linepack considers only volume and is measured in millions
- f cubic meters, which is the volume the gas would cover at