What Is the Output of What Is the Output of Visual Data Analysis? - - PDF document

what is the output of what is the output of visual data
SMART_READER_LITE
LIVE PREVIEW

What Is the Output of What Is the Output of Visual Data Analysis? - - PDF document

What Is the Output of What Is the Output of Visual Data Analysis? Visual Data Analysis? Gennady & Natalia Andrienko Fraunhofer Institute IAIS, Sankt Augustin, Germany http://www.ais.fraunhofer.de/and Visual Analytics Panel @ InfoVis


slide-1
SLIDE 1

1

What Is the Output of What Is the Output of Visual Data Analysis? Visual Data Analysis?

Gennady & Natalia Andrienko Fraunhofer Institute IAIS, Sankt Augustin, Germany http://www.ais.fraunhofer.de/and

Visual Analytics Panel @ InfoVis conference, 6/7/2006, London

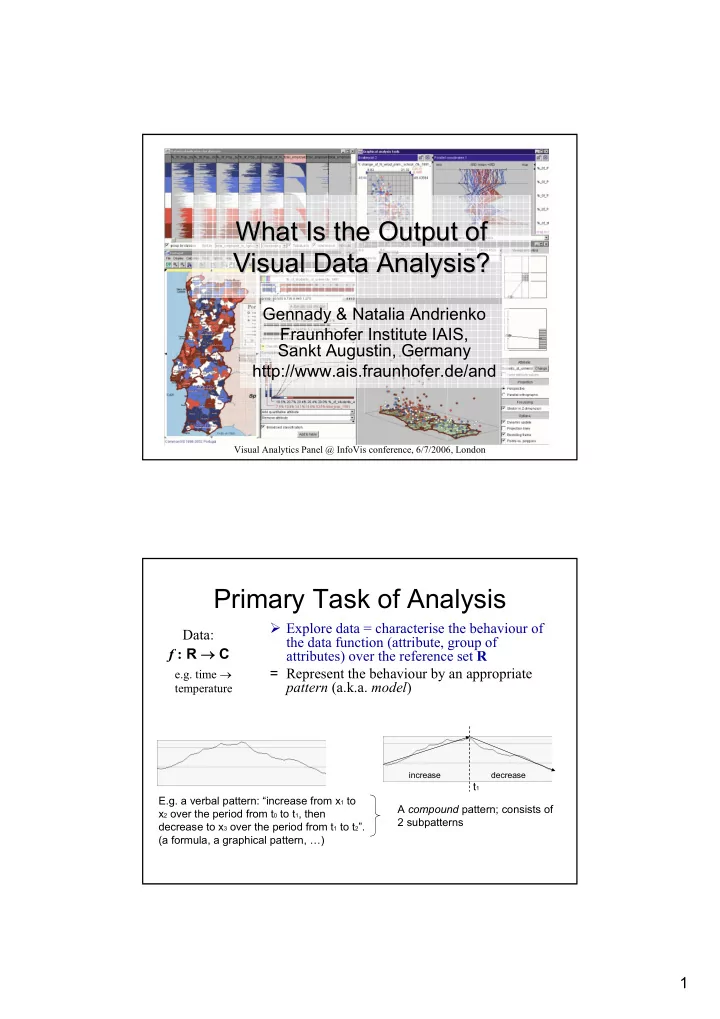
Primary Task of Analysis

Explore data = characterise the behaviour of the data function (attribute, group of attributes) over the reference set R = Represent the behaviour by an appropriate pattern (a.k.a. model) f : R → C

E.g. a verbal pattern: “increase from x1 to x2 over the period from t0 to t1, then decrease to x3 over the period from t1 to t2”. (a formula, a graphical pattern, …) t1

increase decrease

A compound pattern; consists of 2 subpatterns

Data:

e.g. time → temperature

slide-2
SLIDE 2

2

Requirements to Visual Tools

  • Primary task: characterise the behaviour of the data

function over the reference set

⇒The analyst needs a tool allowing him to see simultaneously the entire reference set and all the corresponding characteristics ⇒The tool should represent the characteristics so that they perceptually merge into a single unit (to be seen as a behaviour rather than multiple separate characteristics)

E.g. a good representation: all characteristics are represented by a single line, which is perceived as a unit

But… such a representation is seldom achievable

Data Complexities

Multi-dimensionality

e.g. time × space → temperature

Multiple attributes

e.g. time × space → (temperature, wind, precipitation, …)

Large data volume

e.g. (ti, si, tempi, windi, preci, …); i = 1, 2, …, 1 000 000, …

Complex, heterogeneous nature of the reference set

e.g. geographical space: land, water, mountains, cities, …

Outliers, discontinuities, …

slide-3
SLIDE 3

3

Need for Analysis and Synthesis

Overall behaviour Overall pattern Characterise

The main task:

?

But… The data are too complex!

Need for Analysis and Synthesis

Overall behaviour Partial behaviours Analyse Characterise

The main task:

?

slide-4
SLIDE 4

4

Need for Analysis and Synthesis

Overall behaviour Partial behaviours Analyse Characterise

The main task:

?

Partial patterns Characterise

Need for Analysis and Synthesis

Overall behaviour Partial behaviours Partial patterns Overall pattern Analyse Synthesise Characterise

Tool requirements:

– Support analysis, i.e. division into partial behaviours – Support the characterisation of the partial behaviours – Support the synthesis of the overall pattern

slide-5
SLIDE 5

5

Example: Behaviour over a Two- Dimensional Reference Set

Referrers Space (set of the states of the USA) Time (set of years from 1960 to 2000) Attributes

  • Property crime rate
  • Violent crime rate

This behaviour cannot be represented as a single unit

Slicing a Behaviour

t

Space as a whole Specific time Specific place Time as a whole Spatial behaviour (value distribution over the space) Temporal behaviour (value variation over the time)

slide-6
SLIDE 6

6

Aspectual Behaviours

Time as a whole Spatio-temporal behaviour Space as a whole

Aspect 1: Temporal variation of the spatial behaviour Aspect 2: Spatial variation of the temporal behaviour

t1 t2 t3

Exploring Aspectual Behaviours

1)Temporal variation of the spatial behaviour 2) Spatial variation of the temporal behaviour

  • The diagrams are perceived as separate entities

→ the map must be scanned and cannot be grasped as a single image

  • Absence of ordering complicates seeking for

specific behaviour patterns

  • Diagram overlapping is a serious problem
  • Highly synoptic views, but…
  • no spatial context!
slide-7
SLIDE 7

7

A Possible Approach: Group By Similarity

E.g. by applying cluster analysis

Attend to particulars e.g. extreme changes

1. Transform the time graph to show changes 2. Select extreme changes in a specific year (here 2003)

slide-8
SLIDE 8

8

Synthesising an Overall Pattern

No good tools yet…

Knowledge Synthesis Challenges

  • Decomposition of a complex data analysis task

results in multiple unconnected observations about various aspects of the overall behaviour and interesting particulars

  • These are mostly visual impressions and tacit

ideas

  • How to capture these observations?
  • How to put these together and to get something

tangible?

  • How could this “something” look like?
slide-9
SLIDE 9

9

What Is the Output of Visual Data Analysis?

This is an important scientific question This is not only a scientific question but a matter of survival of the InfoVis community:

– People believe more in texts and numbers than in visualisations (R.Burkhard) – Possibly, because they do not see material results, e.g. models supporting their decisions – A consequence: lack of industrial and research funding (at least in Europe)