
SLIDE 1
Who ho D Do W We Have i in t n the he Room?
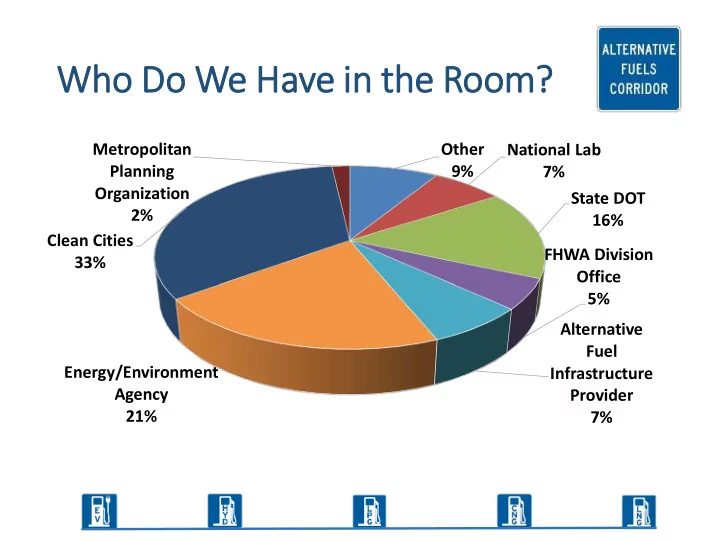
Other 9% National Lab 7% State DOT 16% FHWA Division Office 5% Alternative Fuel Infrastructure Provider 7% Energy/Environment Agency 21% Clean Cities 33% Metropolitan Planning Organization 2%