
SLIDE 1
WIFI FIRE: A A Scalable e Da Data-Driven M Monitoring, D - - PowerPoint PPT Presentation
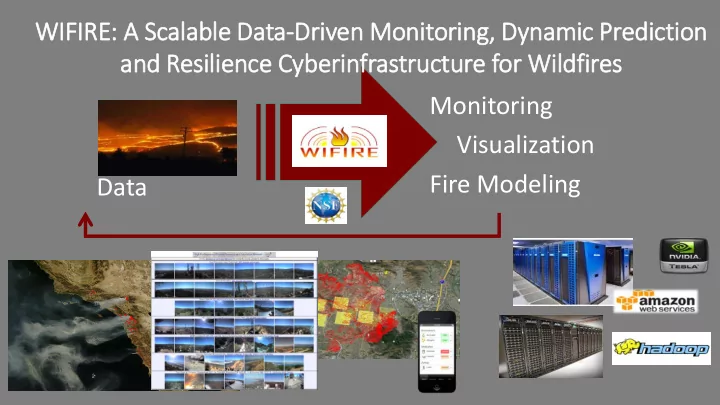
WIFI FIRE: A A Scalable e Da Data-Driven M Monitoring, D Dynamic Prediction and R an Res esil ilie ience C Cyb yberin infrastructure for Wild ildfir ires Monitoring Visualization Fire Modeling Data CA F Fires 10/2017 t 2017
Real-time sensors Weather forecast Fire perimeter Landscape data Monitoring & fire mapping
aRR > 1.0 to <1.5 aRR 1.5 to <2.0 aRR 2.0 to <3.0 aRR 3.0 to <4.0 aRR 4.0 to <5.0 aRR 5.0 to < 6.0 aRR < 1.0 to >0.67 aRR 0.67 to >0.5
Born in Mexico
0.9 (0.8, 1.0)
Underweight BMI
1.3 (1.1, 1.5)
Overweight BMI
0.9 (0.8, 1.0)
Preexisting diabetes
1.7 (1.3, 2.1) 1.9 (1.4, 2.5) 1.8 (1.4, 2.4)
Gestational diabetes
1.3 (1.2, 1.5) 1.3 (1.2, 1.6) 1.4 (1.2, 1.6)
Preexisting hypertension without preeclampsia
1.6 (1.2, 2.1) 1.7 (1.2, 2.3) 1.7 (1.3, 2.3)
Preexisting hypertension with preeclampsia
4.7 (3.7, 6.0) 5.6 (4.3, 7.2) 5.7 (4.4, 7.5)
Gestational hypertension without preeclampsia
1.6 (1.2, 2.0) 1.5 (1.1, 1.9)
Gestational hypertension with preeclampsia
3.5 (3.1, 3.9) 4.1 (3.6, 4.7) 4.4 (3.9, 4.9)
Infection
1.4 (1.3, 1.5) 1.4 (1.2, 1.5) 1.4 (1.3, 1.6)
#Geo4Dev @CEGA_UC | @GPS_UCSD
#Geo4Dev @CEGA_UC | @GPS_UCSD
#Geo4Dev @CEGA_UC | @GPS_UCSD