(0, 1, 1) lecture 23 (0, 0, 1) color (1, 1, 1) - spectra - - - PowerPoint PPT Presentation

0 1 1 lecture 23 0 0 1 color 1 1 1
SMART_READER_LITE
LIVE PREVIEW

(0, 1, 1) lecture 23 (0, 0, 1) color (1, 1, 1) - spectra - - - PowerPoint PPT Presentation

(0, 1, 1) lecture 23 (0, 0, 1) color (1, 1, 1) - spectra - trichromacy and photoreceptor sensitivity (0, 1, 1) - RGB color space - physical vs. perceived [NOT ON FINAL EXAM] (0, 0, 0) (1, 1, 0) (0, 1, 0) Light consists of


slide-1
SLIDE 1

lecture 23 color

  • spectra
  • trichromacy and photoreceptor sensitivity
  • RGB color space
  • physical vs. perceived [NOT ON FINAL EXAM]

(1, 1, 0) (1, 1, 1) (0, 1, 1) (0, 0, 1) (0, 0, 0) (0, 1, 0) (0, 1, 1) hue - which 'color' ? saturation - how pure ? luminance (value) - intensity What is light ? What is color ?

Light consists of electromagnetic waves from 400-700 nm.
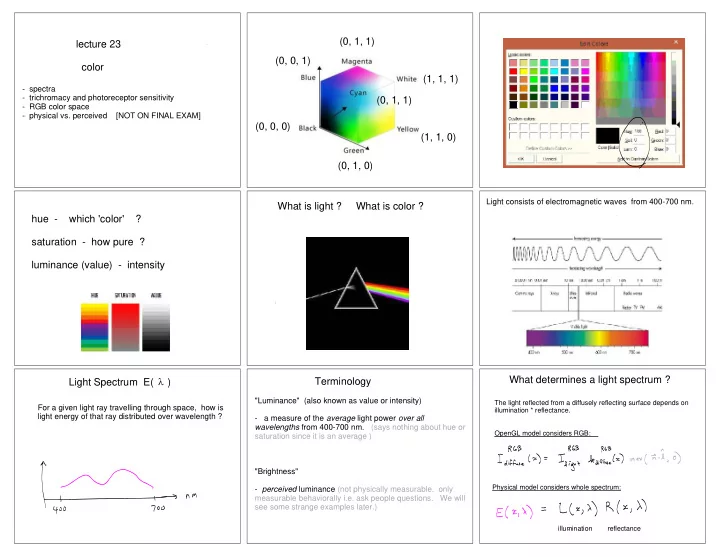
Light Spectrum E( )

For a given light ray travelling through space, how is light energy of that ray distributed over wavelength ?

Terminology

"Luminance" (also known as value or intensity)

  • a measure of the average light power over all

wavelengths from 400-700 nm. (says nothing about hue or saturation since it is an average ) "Brightness"

  • perceived luminance (not physically measurable, only

measurable behaviorally i.e. ask people questions. We will see some strange examples later.)

What determines a light spectrum ?

The light reflected from a diffusely reflecting surface depends on illumination * reflectance. OpenGL model considers RGB: Physical model considers whole spectrum: illumination reflectance

slide-2
SLIDE 2

lecture 23 color

  • spectra
  • trichromacy and photoreceptor sensitivity
  • RGB color space
  • physical vs. perceived [NOT ON FINAL EXAM]

Retinal Images

Images are measured by light sensitive photoreceptor cells in the retina. Two classes of photoreceptors Rod Cone Cones Rods

Rods

  • used at night (low light levels)
  • black/grey/white only

Cones

  • day (bright light)
  • color

Three types of cones

(defined by their light absorbing pigment) L - sensitive to long wavelengths M - sensitive to medium wavelengths S - sensitive to short wavelengths (You may assume for simplicity that these correspond roughly to RGB sensors in camera.) Probability that a photon of wavelength will be absorbed by each type of photoreceptor pigment. (For illustration purposes, each curve is normalized to 1 .)

Spectral sensitivity of cones Spectral sensitivity of RGB camera pixel

  • similar idea: short, medium, long wavelengths

"Bayer pattern" - 2xG, 1xRB. There are technical reasons for using 2G which I won't attempt to explain here. A photoreceptor does not know the distribution of wavelengths of photons that it absorbs. Rather it sums the energy of all absorbed photons.

  • I will be loose with physical units here e.g. energy vs

power]

  • I will not distinguish cones from camera photoreceptors.

"Principle of Univariance" E( x,

) - spectrum of light arriving at cone x

CRGB(

) - spectral absorptance of a photoreceptor [More generally, C is a 'color matching function'. As we will see below, it models when photoreceptors can

  • r cannot discriminate different spectra. ]
slide-3
SLIDE 3

Cone absorptance CRGB may be easier to understand if we discretize the interval of visible light into N bins. This maps an N-D spectrum to a 3-D RGB image.

Metamers

It can easily happen that matrix C maps two different radiance spectra E1( ) and E2( ) to the same cone absorption triples, i.e. the same RGB point. C E1 = C E2 Such spectra E1 and E2 are called 'metamers". They are visually indistinguishable.

Color Blindness

Many people (~8% of males and ~0.5 % of females) are missing a gene for one of the three cone pigments. This leads to three types of "color blindness", depending on which type is missing. "Color blind" doesn't mean the person can't see any colors. Rather, it means that they cannot distinguish some spectra that color normal people can distinguish. (Such spectra are metamers for the color blind person.)

Color Displays

Color displays (TV, computer, cell phone) have three primary lights (RGB). Their emittance spectra can be represented by an Nx3 matrix P ("phosphor emission spectrum") of basis vectors, such that the net emitted light spectra from a pixel is:

Nx1 Nx3 3x1

more to say about in the lecture on displays

P

eye/camera photoreceptor display pixel (capture) sensitivity C P (display)

  • Two different displays P1 and P2 will produce different

captured RGB values. (See Exercises for display matching problem.)

  • We will discuss non-linearity issues in coming lectures.

capture display

Anaglyph 3D Displays

Anaglyph (definition): a stereoscopic photograph with the two images superimposed and printed in different colors, producing a stereo effect when the photograph is viewed through correspondingly colored filters.

How does it work? See Exercises. Left eye's image Right eye's image lecture 23 color

  • spectra
  • trichromacy and photoreceptor sensitivity
  • RGB color space
  • physical vs. perceived [NOT ON FINAL EXAM]
slide-4
SLIDE 4

Monochromatic Light (laser)

maximum saturation SLIDE ADDED: Any spectrum E(  ) is a linear combination of monochromatic spectra (with positive coefficients). E( ) ... + E( ) ... + E( )

The thick black curve below shows RGB points that are the columns of the matrix C (see two slides back). These are the points C Ek where Ek is the kth monochromatic spectrum. The rays from the origin through each RGB point C Ek are defined by varying the strength of each monochromatic spectrum by multiplying it by a constant (as on previous slide). The main idea here is that any spectrum E(  ) is mapped to a linear (convex!) combination of the locus of points shown below. The 3D surface on the previous slide is difficult for novices to visualize, so it is common to display a planar slice through it. The interior below is defined by convex combinations of the boundary

  • points. This is another way to show a color palette.

hue

Saturation increases radially from 0 at the 'white' point near the middle to a max at the boundary.

white A particular display has three spectra that it can produce, namely the columns of matrix P from earlier. The measured RGB values must lie within convex combinations

  • f these three spectra. It must be convex because you

cannot have a negative intensity value at a pixel.

lecture 23 color

  • spectra
  • trichromacy and photoreceptor sensitivity
  • RGB color space
  • physical vs. perceived [NOT ON FINAL EXAM]

physical intensity (or color) = perceived intensity (or color) Why not ?

  • They are different things (what is meant by "=" is different

in physics and perception )

  • Knowing physical luminance or color of light is useless for
  • survival. The color of a material (i.e. reflectance as a

function of wavelength) is more important. I deal with this and other perceptual issues is greater detail in my course COMP 546 Computational Perception offered in Fall 2015.

Example

Paper on the left is in shadow. It is darker (lower physical intensity) and it appears darker (lower perceived intensity) Image is processed so that the left paper is given same image intensities as right paper. Now, left paper appears

  • brighter. Why?
slide-5
SLIDE 5

Similarly, image is processed so that the right paper is given same image intensities as left paper. Now, right paper appears darker. Why? Physically... surface luminance (x,y) = surface reflectance (x,y) * illumination (x,y) Perceptually... ? The brightness of a surface is often more determined by the perceived reflectance than the perceived luminance. Indeed, when we talk about color of things we see, we are typically talking about material properties rather than properties of light. Many perception studies have used simple images to explore relationships between perceived and physical quantities. Small gray squares have equal luminance but the square

  • n the left appears brighter.

(The left half does not appear to be a shadow, however.) The light and dark small grey bars in fact have the same luminance, but the ones on the left are much brighter. This is a bigger effect than on the previous slide. Several theories exist to explain why this happens. This will be discussed more in COMP 546. The same questions arise in color vision. The small squares have the same RGB image values but the one on the left appears more yellowish. Why? same reds same greens