1 Mean = 180.6 = 15.05 or 15.1 B1 for mean (i) 12 180.6 2 M1 - - PDF document

1 mean 180 6 15 05 or 15 1 b1 for mean i 12 180 6 2 m1
SMART_READER_LITE
LIVE PREVIEW

1 Mean = 180.6 = 15.05 or 15.1 B1 for mean (i) 12 180.6 2 M1 - - PDF document

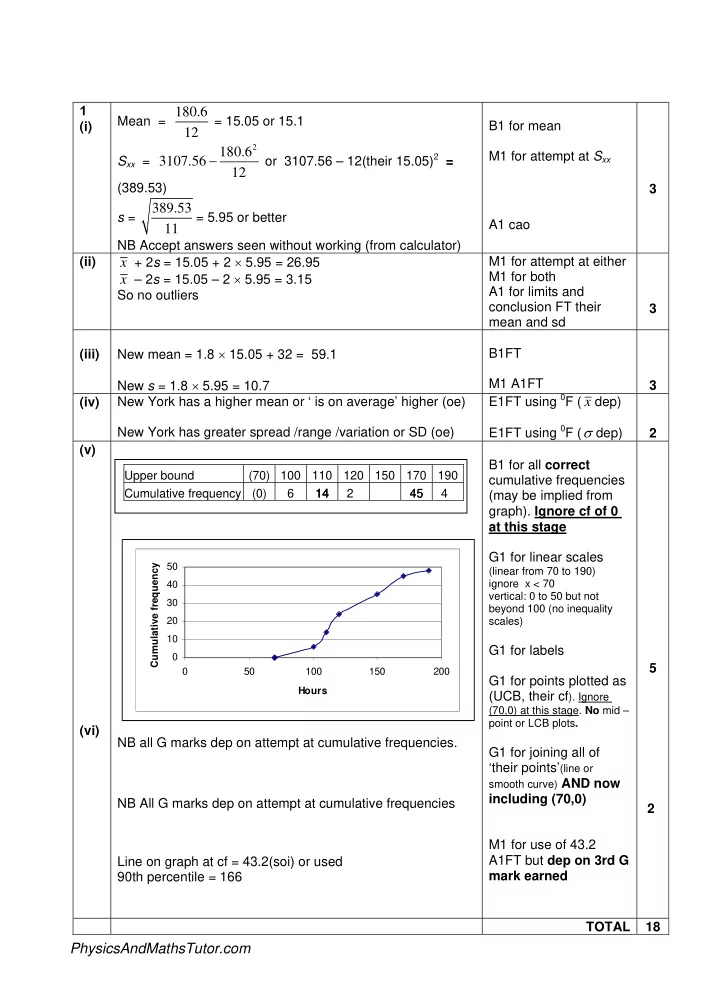
1 Mean = 180.6 = 15.05 or 15.1 B1 for mean (i) 12 180.6 2 M1 for attempt at S xx or 3107.56 12(their 15.05) 2 = S xx = 3107.56 12 (389.53) 3 389.53 s = = 5.95 or better A1 cao 11 NB Accept answers seen without working (from


slide-1
SLIDE 1

1 (i) Mean = 180.6

12

= 15.05 or 15.1 Sxx =

180.62

3107.56

12 −

  • r 3107.56 – 12(their 15.05)2 =

(389.53)

389.53

s = = 5.95 or better

11

NB Accept answers seen without working (from calculator) B1 for mean M1 for attempt at Sxx A1 cao 3 (ii)

x + 2s = 15.05 + 2 × 5.95 = 26.95 x – 2s = 15.05 – 2 × 5.95 = 3.15

So no outliers M1 for attempt at either M1 for both A1 for limits and conclusion FT their mean and sd 3 (iii) New mean = 1.8 × 15.05 + 32 = 59.1 New s = 1.8 × 5.95 = 10.7 B1FT M1 A1FT 3 (iv) New York has a higher mean or ‘ is on average’ higher (oe) New York has greater spread /range /variation or SD (oe) E1FT using 0F ( x dep) E1FT using 0F (σ dep) 2 (v) (vi) NB all G marks dep on attempt at cumulative frequencies. NB All G marks dep on attempt at cumulative frequencies Line on graph at cf = 43.2(soi) or used 90th percentile = 166 B1 for all correct cumulative frequencies (may be implied from graph). Ignore cf of 0 at this stage G1 for linear scales

(linear from 70 to 190) ignore x < 70 vertical: 0 to 50 but not beyond 100 (no inequality scales)

G1 for labels G1 for points plotted as (UCB, their cf). Ignore

(70,0) at this stage. No mid – point or LCB plots.

G1 for joining all of ‘their points’(line or

smooth curve) AND now

including (70,0) M1 for use of 43.2 A1FT but dep on 3rd G mark earned 5 2 TOTAL 18

Upper bound (70) 100 110 120 150 170 190 Cumulative frequency (0) 6 14 14 14 2 45 45 4

10 20 30 40 50 50 100 150 200 Hours Cumulative frequency

PhysicsAndMathsTutor.com

slide-2
SLIDE 2

2 (i)

G1 Labelled linear scales G1 Height of lines

2 (ii)

Negative (skewness) B1

1 (iii) Σfx = 123 so mean = 123/25 = 4.92 o.e.

1232 681 25

xx

− S = = 75.84

M.s.d = 75.84

25 = 3.034

B1 M1 for Sxx attempted A1 FT their 4.92

3 (iv) Total for 25 days is 123 and totals for 31 days is 155.

Hence total for next 6 days is 32 and so mean = 5.33 M1 31 x 5 – 25xtheir 4.92 A1 FT their 123

2

TOTAL

8

1 2 3 4 5 6 7 8 2 1 5 4 5 4 Number Correct Frequency

PhysicsAndMathsTutor.com

slide-3
SLIDE 3

3 (i) (ii) (iii)

Length of journey

20 40 60 80 1 00 1 20 2 4 6 8 1 Lengt h of journey

Median = 1.7 miles Lower quartile = 0.8 miles Upper quartile = 3 miles Interquartile range = 2.2 miles The graph exhibits positive skewness G1 G1 G1 B1 M1 M1 A1 ft E1 For calculating 38,68,89,103,112,120 Plotting end points Heights inc (0,0) PhysicsAndMathsTutor.com