
SLIDE 1
20
Mid-America Earthquake Center Mid-America Earthquake Center
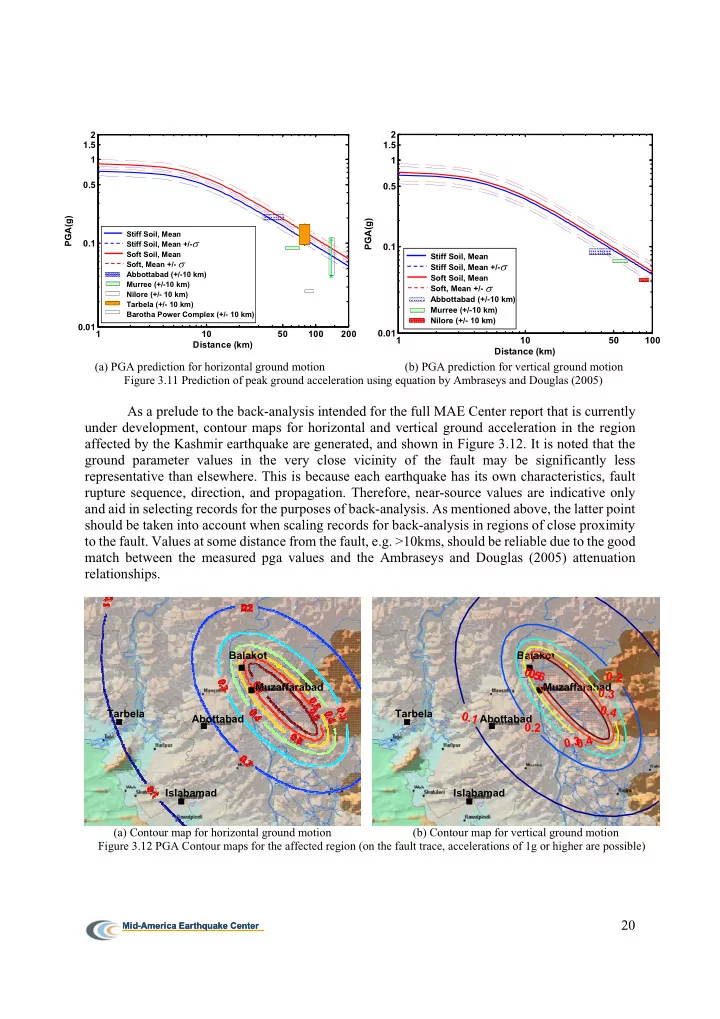
(a) PGA prediction for horizontal ground motion (b) PGA prediction for vertical ground motion Figure 3.11 Prediction of peak ground acceleration using equation by Ambraseys and Douglas (2005)
As a prelude to the back-analysis intended for the full MAE Center report that is currently under development, contour maps for horizontal and vertical ground acceleration in the region affected by the Kashmir earthquake are generated, and shown in Figure 3.12. It is noted that the ground parameter values in the very close vicinity of the fault may be significantly less representative than elsewhere. This is because each earthquake has its own characteristics, fault rupture sequence, direction, and propagation. Therefore, near-source values are indicative only and aid in selecting records for the purposes of back-analysis. As mentioned above, the latter point should be taken into account when scaling records for back-analysis in regions of close proximity to the fault. Values at some distance from the fault, e.g. >10kms, should be reliable due to the good match between the measured pga values and the Ambraseys and Douglas (2005) attenuation relationships.
(a) Contour map for horizontal ground motion (b) Contour map for vertical ground motion Figure 3.12 PGA Contour maps for the affected region (on the fault trace, accelerations of 1g or higher are possible)
1 10 50 100 0.01 0.1 0.5 1 1.5 2 Distance (km) PGA(g)
Stiff Soil, Mean Stiff Soil, Mean +/- Soft Soil, Mean Soft, Mean +/- Abbottabad (+/-10 km) Murree (+/-10 km) Nilore (+/- 10 km)
- 1
10 50 100 200 0.01 0.1 0.5 1 1.5 2 Distance (km) PGA(g)
Stiff Soil, Mean Stiff Soil, Mean +/- Soft Soil, Mean Soft, Mean +/- Abbottabad (+/-10 km) Murree (+/-10 km) Nilore (+/- 10 km) Tarbela (+/- 10 km) Barotha Power Complex (+/- 10 km)
- Tarbela