
SLIDE 1
CBC Presentation Solomons, MD September 2017
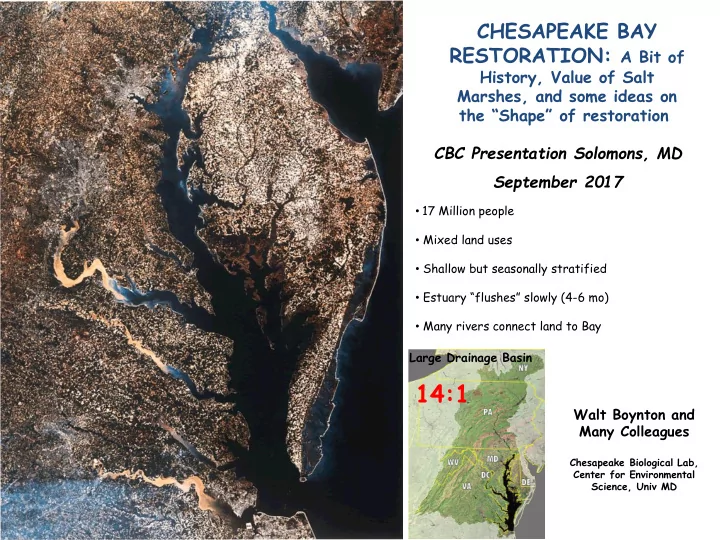
14:1
- 17 Million people
- Mixed land uses
- Shallow but seasonally stratified
- Estuary “flushes” slowly (4-6 mo)
- Many rivers connect land to Bay
Large Drainage Basin
Walt Boynton and Many Colleagues
Chesapeake Biological Lab, Center for Environmental Science, Univ MD
CHESAPEAKE BAY RESTORATION: A Bit of
History, Value of Salt Marshes, and some ideas on the “Shape” of restoration