
SLIDE 1
14-Sep-16 1
Molecular and Cellular Biology
- 6. Biomembrane: Structure & Function
- Prof. Dr. Klaus Heese
14-Sep-16 Biomembrane Molecular and Cellular Biology 6. - - PDF document
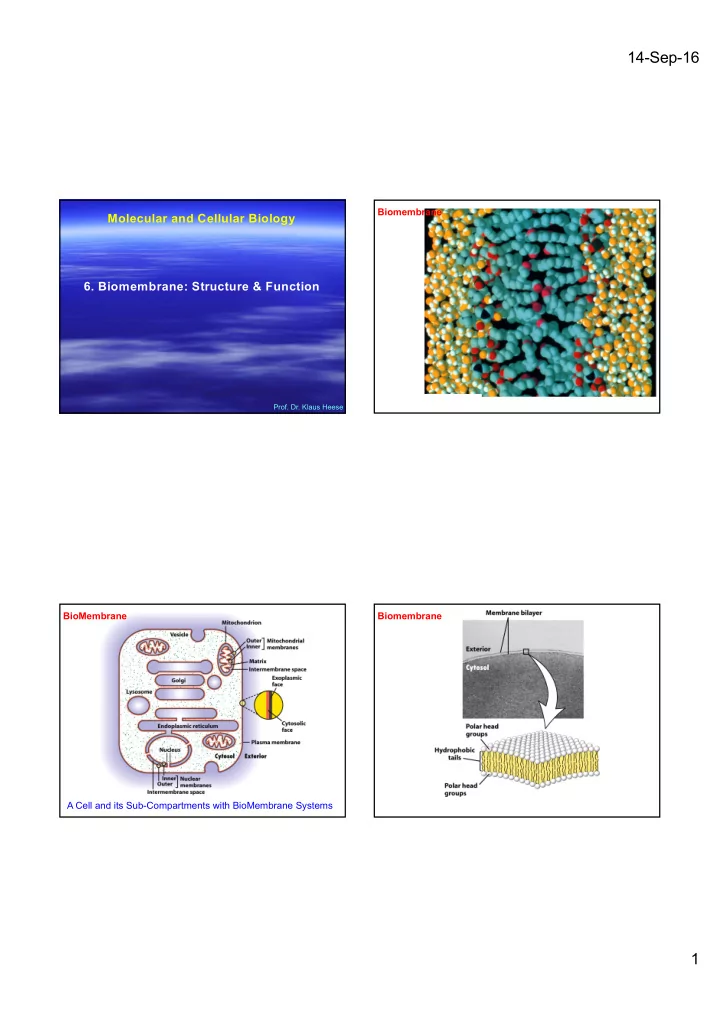
14-Sep-16 Biomembrane Molecular and Cellular Biology 6. Biomembrane: Structure & Function Prof. Dr. Klaus Heese BioMembrane Biomembrane A Cell and its Sub-Compartments with BioMembrane Systems 1 14-Sep-16 Biomembrane Biomembrane
(c) Cholesterol within the animal cell membrane Cholesterol
Adding Cholesterol to a cell membrane reduces fluidity, therefore, making the cell membrane more rigid reducing phospholipid movement. Without cholesterol, cell membranes would be too fluid, not firm enough, and too permeable to some molecules. While cholesterol adds firmness and integrity to the plasma membrane and prevents it from becoming overly fluid, it also helps to maintain its fluidity. At the high concentrations as it is found in our cell's plasma membranes cholesterol helps to separate the phospholipids so that the fatty acid chains can't come together and crystallize. Therefore, cholesterol helps to prevent extremes-- whether too fluid, or too firm -- in the consistency of the cell membrane.
(lipid; PS)
The white spheres depict the hydrophilic heads of the phospholipids, and the squiggly black lines (in the yellow regions) represent the hydrophobic tails. Shown are a spherical micelle with a hydrophobic interior composed entirely of fatty acyl chains; a spherical liposome, which has two phospholipid layers and an aqueous center; and a two-molecule-thick sheet of phospholipids, or bilayer, the basic structural unit of bio-membranes.
EXTRACELLULAR FLUID Pseudopodium CYTOPLASM “Food” or
Food vacuole 1 µm Pseudopodium
Bacterium Food vacuole An amoeba engulfing a bacterium via phagocytosis (TEM).
PINOCYTOSIS
Pinocytosis vesicles forming (arrows) in a cell lining a small blood vessel (TEM). 0.5 µm In pinocytosis, the cell “gulps” droplets of extracellular fluid into tiny
itself that is needed by the cell, but the molecules dissolved in the droplet. Because any and all included solutes are taken into the cell, pinocytosis is nonspecific in the substances it transports. Plasma membrane Vesicle In phagocytosis, a cell engulfs a particle by Wrapping pseudopodia around it and packaging it within a membrane- enclosed sac large enough to be classified as a vacuole. The particle is digested after the vacuole fuses with a lysosome containing hydrolytic enzymes.
PHAGOCYTOSIS
0.25 µm
RECEPTOR-MEDIATED ENDOCYTOSIS
Receptor Ligand Coat protein Coated pit Coated vesicle A coated pit and a coated vesicle formed during receptor- mediated endocytosis (TEMs). Plasma membrane Coat protein Receptor-mediated endocytosis enables the cell to acquire bulk quantities of specific substances, even though those substances may not be very concentrated in the extracellular fluid. Embedded in the membrane are proteins with specific receptor sites exposed to the extracellular fluid. The receptor proteins are usually already clustered in regions of the membrane called coated pits, which are lined on their cytoplasmic side by a fuzzy layer of coat proteins. Extracellular substances (ligands) bind to these receptors. When binding occurs, the coated pit forms a vesicle containing the ligand molecules. Notice that there are relatively more bound molecules (purple) inside the vesicle, other molecules (green) are also present. After this ingested material is liberated from the vesicle, the receptors are recycled to the plasma membrane by the same vesicle.
Aquaporin, the water channel, consists of four identical transmembrane polypeptides
A bilayer is permeable to small hydrophobic molecules and small uncharged polar molecules, slightly permeable to water and urea, and essentially impermeable to ions and to large polar molecules.
Gradients are indicated by triangles with the tip pointing toward lower concentration, electrical potential, or both. 1: pumps utilize the energy released by ATP hydrolysis to power movement of specific ions (red circles) or small molecules against their electrochemical
by e.g. ligand binding or phosphorylations etc : Transporters, which fall into three groups, facilitate movement of specific small molecules or ions. Uniporters transport a single type of molecule down its concentration gradient (3A). Cotransport proteins (symporters (3B) and antiporters (3C) catalyze the movement of one molecule against its concentration gradient (black circle), driven by movement of one or more ions down an electrochemical gradient (red circles). Differences in the mechanisms of transport by these three major classes of proteins account for their varying rates of solute movement. Transporters can also depend on ATP.
The initial transport rate for the substrate S into the cell catalyzed by e.g. GLUT1: v=Vmax/(1+Km/[S])
The initial rate of glucose uptake (measured as micromoles per milliliter of cells per hour) in the first few seconds is plotted against increasing glucose concentration in the extracellular medium. In this experiment, the initial concentration of glucose in the cells is always zero. Both, GLUT1, expressed by erythrocytes, and GLUT2, expressed by liver cells, greatly increase the rate of glucose uptake (red and orange curves) at all external concentrations. Like enzyme-catalyzed reactions, GLUT-facilitated uptake of glucose exhibits a maximum rate (Vmax). The Km is the concentration at which the rate of glucose uptake is half maximal. GLUT2, with a Km
In one conformation, the glucose-binding site faces outward; in the other, the binding site faces inward. Binding of glucose to the outward-facing site (step-1) triggers a conformational change in the transporter that results in the binding site facing inward toward the cytosol (step-2). Glucose then is released to the inside of the cell (step 3). Finally, the transporter undergoes the reverse conformational change, regenerating the outward-facing binding site (step 4). If the concentration of glucose is higher inside the cell than outside, the cycle will work in reverse (step-4 ---> step-1), resulting in net movement of glucose form inside to out. The actual confomrational changes are probably smaller than those depicted here.
Simultaneous binding of Na+ and glucose to the conformation with outward-facing binding sites (step-1) generates a second conformation with inward-facing site (step-2). Dissociation of the bound Na+ and glucose into the cytosol (step-3) allows the protein to revert to its original outward-facing conformation (step-4), ready to transport additional substrate.
Here, all the integral proteins of the erythrocyte membrane are solubilized by a nonionic detergent, such as octylglucoside. The glucose uniporter GLUT1 can be purified by chromatography on a column containing a specific antibody and then incorporated into liposomes made of pure phospholipids.
Only one of the two catalytic alpha subunits of this P-class pump is depicted. E1 and E2 are alternative conformations of the protein in which the Ca2+-binding sites are accessible to the cytosolic and exoplasmic faces, respectively. An ordered sequence of steps (1-6) is essential for coupling ATP hydrolysis and the transport of Ca2+ ions across the membrane. In this figure ~P indicates a high-energy acyl phosphate bond; -P indicates a low-energy phosphoester bond. Because the affinity of Ca2+ for the exoplasmic-facing sites in E2, this pump transports Ca2+ uni- directionally from the cytosol to the SR lumen.
(a) 3-D models of the protein in the E1 state based on the structure determined by X-ray crystallography. There are 10 transmembrane alpha helices, 4 of which (green) contain residues that site-specific mutagenesis studies have identifies as participating in Ca2+ binding. The cytosolic segment forms 3 domains: the nucleotide binding domain (orange) the phosphorylation domain (yellow) and the actuator domain (pink) that connects 2 of the membrane-spanning helices. (b) Hypothetical model of the pump in E2 state, based on a lower resolution structure determined by electron microscopy of frozen crystals of the pure protein. Note the differences between the E1 and E2 states in the confirmations of the nucleotide- binding and actuator domains; these changes probably power the conformational changes of the membrane-spanning alpha helices (green) that constitute the Ca2+-binding site, converting them form one in which the Ca2+-binding sites are accessible to the cytosolic face (E1 state) to one in which they are accessible to the exoplasmic face (E2 state).
Only one of the two catalytic alpha subunits of this P-class pump is depicted. It is not known whether only one or both subunits in a single ATPase molecule transport ions. Ion pumping by the Na+/K+ ATPase (very important in neurons) involves phosphorylation, dephosphorylation and conformational changes similar to those in the muscle Ca2+ ATPase, in this case, hydrolysis of the E2-P intermediate powers the E2--->E1 conformational change and concomitant transport of two ions (K+) inward. Na+ ions are indicated by red circles; K+ ions by purple squares; high energy acyl phosphate bond by ~P; low-energy phosphoester bon by -P.
(a) If an intracellular organelle contains only V-class pumps, proton pumping generates an electric potential across the membrane, luminal-side positive, but no significant change in the intraluminal pH. (b) if the organelle also contains Cl- channels, anions passively follow the pumped protons, resulting in an accumulation of H+ ions (low luminal pH) but no electric potential across the membrane.
F-class pumps do not form phosphoprotein intermediates and transport only protons. V/F-class structures are similar and contain similar proteins, but none of their subunits are related to the P-class pumps. F-class pumps operate in the reverse directions (compared to V-class) to utilize energy in a proton concentration or electrochemical gradient to synthesize ATP.
F1 complexes were engineered that contained b subunits with an additional His6 sequence, which causes them to adhere to a glass plate coated with a metal reagent that binds histidine. The g subunit in the engineered F1 complexes was linked covalently to a fluorescently labeled actin filament. When viewed in a fluorescence microscope, the actin filaments were seen to rotate counterclockwise in discrete 120º steps in the presence of ATP, powered by ATP hydrolysis by the b subunits.
The V-shaped protein encloses a “chamber” within the bilayer where it is hypothesized that bound substrates are flipped across the membrane, as shown in the next slide. Each identical subunit in this homodimeric protein has one transmembrane domain, comprising six alpha helices, and one cytosolic domain where ATP binding occurs.
1: the hydrophobic portion (black) of a substrate molecule moves spontaneously from the cytosol into the cytosol- facing leaflet lipid bilayer, while the charged end (red) remains in the cytosol. 2: the substrate diffuses laterally until encountering and binding to a site on the MDR1 protein within the bilayer. 3: the protein then flips the charged substrate molecule into the exoplasmic leaflet, an energetically unfavorable reaction powered by the coupled hydrolysis of ATP by the cytosolic domain. 4+5: Once in the exoplasmic face, the substrate again can diffuse laterally in the membrane and ultimately moves into the aqueous phase on the outside of the cell. Structural features
are membrane- associated with six membrane- spanning regions, and are characterized by the presence of the ABC region. (A) ABCB1 typically is a full-length transporter of two identical halves as shown, with two NBDs that contain conserved sequences of the
is a half-transporter consisting of one NBD containing an ABC, followed by a six membrane- spanning domain.
Expression of ABCB1 during hNSPCs differentiation. hNSPCs (neurospheres) were induced to differentiate into glia and were then passaged four times. The graph shows the relative time course expression of ABCB1, nestin and GFAP in these hNSPCs
Schematic illustration of the effect of ABC transporters on stem cell proliferation and differentiation. (1) Expression of ABC transporters (especially ABCB1 and ABCG2) in stem cells like the NSCs, HSCs or pancreatic stem cells is thought to be essential for their in vivo proliferation and probably their self- renewal activity. (2) Enforced expression of ABCB1 or ABCG2 leads to enhanced proliferation in HSCs. (3) Downregulation of ABCB1 or ABCG2 in HSCs is observed with the differentiation of HSCs. (4) Downregulation of the ABC transporters in NSCs is observed with the differentiation into astrocytes or neurons. (5) The hypothesis suggests that expression of the ABC transporters in NSCs may have an effect on NSC differentiation or proliferation, such that significant upregulation of ABCB1
increase in self-renewal of NSCs, and correspondingly, a decrease in ABCB1 or ABCG2 expression may lead to increased differentiation of NSCs.
ABC transporters, neural stem cells and neurogenesis--a different perspective. Lin T, Islam O, Heese K. Cell Res. 2006 Nov;16(11):857-71. Review.
The vacuolar membrane contains two types of proton pumps (orange): a V-class H+ ATPase (left) and a pyrophosphate-hydrolyzing proton pump (right) that differ from all other ion-transport proteins and probably is unique to plants. These pumps generate a low luminal pH as well as an inside- positive electric potential across the vacuolar membrane owing to the inward pumping of H+ ions. The inside-positive potential powers the movement of Cl- and NO3- from the cytosol through separate channel proteins (purple). Proton (H+) antiporters (green), powered by the H+ gradient, accumulate Na+ and Ca2+ and sucrose inside the vacuole.
Solution A and B are separated by a membrane that is permeable to water but impermeable to all
flow across the mebrane form solution A to solution B. the osmotic pressure p between the solutions is the hydrostatic pressure that would have to be applied to solution B to prevent this water flow. From the van’t Hoff equation, osmotic pressure is given by p = RT ([B]-[A]), where R is the gas constant and T is the absolute temperature.
In this experimental system a membrane separates a 15 mM NaCl/150 mM KCl solution (left) from a 150 mM NaCl/15mM KCl solution (right); these ion concentrations are similar to those in cytosol and blood, respectively. If the membrane separating the two solutions is impermeable to all ions (a), no ions can move across the membrane and no difference in electric potential is registered on the potentiometer connecting the two solutions.
If the membrane is selectively permeable only to Na+, then diffusion of ion through their respective channels leads to a separation of charge across the membrane. At equilibrium, the membrane potential caused by the charge separation becomes equal to the Nernst potential ENa registered on the photometer.
If the membrane is selectively permeable only to K+, then diffusion of ion through their respective channels leads to a separation of charge across the membrane. At equilibrium, the membrane potential caused by the charge separation becomes equal to the Nernst potential EK registered on the photometer.
As with all ions, the movement of Na+ ions across the plasma membrane is governed by the sum of two separate forces: the ion concentration gradient and the membrane electric potential. At the internal and external Na+ concentrations typical of mammalian cells, these forces usually act in the same direction, making the inward movement of Na+ ions energetically favorable.
Two forces govern the movement of ions across selectively permeable membranes: the voltage and the ion concentration gradient across the membrane. The sum of the two forces, which may act in the same or in opposite directions, constitute the electrochemical gradient. To calculate the free-energy change DG corresponding to the transport of any ion across a membrane, we need to consider the independent contributions from each of the forces to the electrochemical gradient. E.g. when Na+ moves from outside to inside the cell, the free-energy change generated by Na+ concentration gradient is given by: DGC = RT ln [Nain]/[Naout] ; at the concentration of [Nain] and [Naout] = 12 mM and 145 mM (typical for many mammalian cells), respectively, DGC , the change in free energy due to the concentration gradient, is -1.45 kcal for transport of 1 mol Na+ ions from
The free-energy change generated from the membrane electric potential is given by: DGm = FE (F = Faraday constant, E = membrane electric potential. If E = - 70 mV, then DGm , the free-energy change due to the membrane potential, is -1.61 kcal for transport of 1 mol Na+ ions from outside to inside the cell, assuming there is no Na+ concentration gradient. Since both forces in fact act on Na+ ions, the total DG is the sum of the two partial values: DG = DGC + DGm = (-1.45) + (-1.61) = -3.06 kcal/mol
2 Na+out + glucoseout <----> 2 Na+in + glucosein DG is the sum of the free-energy changes generated by glucose concentration gradient, the Na+ concentration gradient and the membrane potential. DG = RT ln [glucosein]/[glucoseout] + 2 RT ln [Na+in]/[Na+out] + 2 FE At equilibrium DG = 0. From previous figure we know that DG is about -3 kcal per mole Na+ transported ---> 0 = RT ln [glucosein]/[glucoseout] - 6 kcal ---> [glucosein]/[glucoseout] ~ 30,000 Thus, inward flow of 2 moles of Na+ can generate an intracellular glucose concentration that is 30,000 times greater than the exterior concentration. For 1 mole Na+ it would be