
SLIDE 1
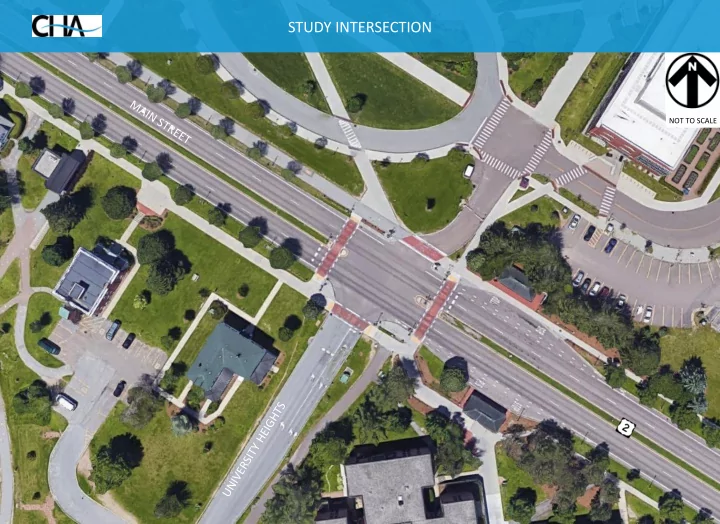
STUDY INTERSECTION
NOT TO SCALE
STUDY INTERSECTION NOT TO SCALE DATA COLLECTION ATR Count Period: - - PowerPoint PPT Presentation
STUDY INTERSECTION NOT TO SCALE DATA COLLECTION ATR Count Period: Sep 3 Sep 6, 2019 TMC Count Dates: Wednesday Sep 4, 2019 Thursday Sep 5, 2019 Intersection Count Periods: 7 am to 10 am 4 pm to 7 pm Peak Hours: AM PM WED: 7:45 to
NOT TO SCALE
XXX (XXX) AM Peak Hour PM Peak Hour
XXX (XXX) AM Peak Hour PM Peak Hour
XXX (XXX) AM Peak Hour PM Peak Hour
XXX (XXX) AM Peak Hour PM Peak Hour
Pedestrian Destinations after arriving at corner from crosswalk
Scenario Approach Geometries Peak Street Approach Lane Group Weekday AM Peak Weekday PM Peak LOS Delay
(sec/veh)
LOS Delay
(sec/veh)
Existing Geometry & Signal Phasing Northbound Southbound Eastbound Westbound Vehicle Peak Hour University Heights NB Left-turn Left-Thru-Right C C 30.1 33.6 C 29.8 F 122.0 UMV Access SB Left-Thru-Right C 23.4 C 22.2 Main Street EB Thru-Right A 9.0 B 17.7 WB Thru B 11.4 B 14.4 Overall Intersection B 11.5 C 23.9 Pedestrian Peak Hour University Heights NB Left-turn Left-Thru-Right C D 28.5 35.2 C 30.5 F 137.9 UMV Access SB Left-Thru-Right C 22.9 C 22.2 Main Street EB Thru-Right A 9.0 B 16.9 WB Thru B 10.2 B 14.7 Overall Intersection B 11.0 C 24.9 Modified NB Geometry & Existing Signal Phasing Northbound Southbound Eastbound Westbound Vehicle Peak Hour University Heights NB Left-Thru Right-turn C C 32.7 30.9 C 31.1 F 101.5 UMV Access SB Left-Thru-Right C 23.2 C 22.2 Main Street EB Thru-Right A 9.1 B 17.7 WB Thru B 11.5 B 14.4 Overall Intersection B 11.6 C 22.2 Pedestrian Peak Hour University Heights NB Left-Thru Right-turn C C 29.1 34.3 C 30.8 F 117.9 UMV Access SB Left-Thru-Right C 23.0 C 22.2 Main Street EB Thru-Right A 8.8 B 16.9 WB Thru B 10.0 B 14.7 Overall Intersection B 10.9 C 23.1
Option 1: Reconfigure NB Approach Lanes Peak Hour of Adjacent Street Traffic University Heights NB Left-Thru Right 245 100 50 100 25 50 75 125 125 250 SB Left-Thru-Right 30 25 25 25 25 Main Street EB Thru-Right 400 150 225 300 400 WB Thru 1000 275 350 225 300 Peak Hour of Pedestrian Traffic University Heights NB Left-Thru Right 245 100 50 75 25 75 75 150 125 250 SB Left-Thru-Right 30 25 25 25 25 Main Street EB Thru-Right 400 125 175 275 375 WB Thru 1000 175 250 250 325 Scenario Condition Street Approac h Lane Group Link Distance (feet) Turn Bay Length (feet) Weekday AM Peak Hour 50th %tile 95th %tile Queue Queue (feet) (feet) Weekday PM Peak Hour 50th %tile 95th %tile Queue Queue (feet) (feet) Existing Condition Peak Hour of Adjacent Street Traffic University Heights NB Left Left-Thru-Right 245 100 50 75 25 75 75 125 150 275 SB Left-Thru-Right 30 25 25 25 25 Main Stret EB Thru-Right 400 150 225 300 400 WB Thru 1000 275 350 225 300 Peak Hour of Pedestrian Traffic University Heights NB Left-Thru Right 245 100 50 75 25 75 75 125 150 275 SB Left-Thru-Right 30 25 25 25 25 Main Street EB Thru-Right 400 125 175 275 375 WB Thru 1000 175 250 250 325
Scenario Approach Geometries Peak Street Approach Lane Group Weekday AM Peak Weekday PM Peak LOS Delay
(sec/veh)
LOS Delay
(sec/veh)
Modified NB Geometry & Exclusive Ped Phase Northbound Southbound Eastbound Westbound Vehicle Peak Hour University Heights NB Left-Thru Right-turn D C 46.7 34.6 D D 42.9 43.3 UMV Access SB Left-Thru-Right C 32.8 C 29.8 Main Street EB Thru-Right B 17.2 C 32.7 WB Thru C 23.0 C 25.7 Overall Intersection C 21.7 C 30.9 Pedestrian Peak Hour University Heights NB Left-Thru Right-turn D D 42.6 35.9 D D 43.2 43.3 UMV Access SB Left-Thru-Right C 33.3 C 29.5 Main Street EB Thru-Right B 15.8 C 30.7 WB Thru B 18.2 C 26.1 Overall Intersection B 18.6 C 30.2 Modified NB Geometry & Extended NB Phase Northbound Southbound Eastbound Westbound Vehicle Peak Hour University Heights NB Left-Thru Right-turn C B 22.9 19.5 C D 21.9 44.8 UMV Access SB Left-Thru-Right C 24.8 C 23.0 Main Street EB Thru-Right B 15.0 C 33.9 WB Thru C 20.4 C 23.1 Overall Intersection B 18.4 C 29.6 Pedestrian Peak Hour University Heights NB Left-Thru Right-turn C C 21.3 20.5 C D 26.0 47.8 UMV Access SB Left-Thru-Right C 25.0 C 24.8 Main Street EB Thru-Right B 14.0 C 26.4 WB Thru B 15.9 C 21.0 Overall Intersection B 15.5 C 25.5
Option 3: Extended NB Phase Peak Hour of Adjacent Street Traffic University Heights NB Left-Thru Right 245 100 25 75 25 50 50 100 75 150 SB Left-Thru-Right 30 25 25 25 25 Main Street EB Thru-Right 400 225 300 425 575 WB Thru 1000 375 550 300 475 Peak Hour of Pedestrian Traffic University Heights NB Left-Thru Right 245 100 50 75 25 50 75 125 75 175 SB Left-Thru-Right 30 25 25 25 25 Main Street EB Thru-Right 400 175 225 350 500 WB Thru 1000 250 325 300 400 Scenario Condition Street Approac h Lane Group Link Distance (feet) Turn Bay Length (feet) Weekday AM Peak Hour 50th %tile 95th %tile Queue Queue (feet) (feet) Weekday PM Peak Hour 50th %tile 95th %tile Queue Queue (feet) (feet) Option 2: Exclusive Pedestrian Phase Peak Hour of Adjacent Street Traffic University Heights NB Left-Thru Right 245 100 50 100 25 50 100 150 125 200 SB Left-Thru-Right 30 25 25 25 25 Main Street EB Thru-Right 400 250 350 525 675 WB Thru 1000 425 650 375 550 Peak Hour of Pedestrian Traffic University Heights NB Left-Thru Right 245 100 50 100 50 75 100 175 125 200 SB Left-Thru-Right 30 25 25 25 25 Main Street EB Thru-Right 400 200 275 500 650 WB Thru 1000 300 400 375 550
680 (620) 450 (490) 60 (65) 35 (70) 685 (620) 455 (495) 1,305 (1,175) 870 (915) Scenario Peak Street Approach Lane Group Weekday AM Peak Weekday PM Peak LOS Delay
(sec/veh)
LOS Delay
(sec/veh)
Existing Pedestrian Distributions Vehicle Peak Hour 500 (710) 80 (105) University Heights NB Left-turn Left-Thru-Right C C 30.1 33.6 C 29.8 F 122.0 UMV Access SB Left-Thru-Right C 23.4 C 22.2 Main Street EB Thru-Right A 9.0 B 17.7 WB Thru B 11.4 B 14.4 Overall Intersection B 11.5 C 23.9 Pedestrian Peak Hour 820 (1,040) 90 (125) University Heights NB Left-turn Left-Thru-Right C D 28.5 35.2 C 30.5 F 137.9 UMV Access SB Left-Thru-Right C 22.9 C 22.2 Main Street EB Thru-Right A 9.0 B 16.9 WB Thru B 10.2 B 14.7 Overall Intersection B 11.0 C 24.9 50-50 Pedestrian Distribution Crossing Main Street Vehicle Peak Hour 85 (290) 495 (525) University Heights NB Left-Thru Right-turn D C 39.1 32.0 D 44.2 E 71.3 UMV Access SB Left-Thru-Right C 22.8 C 22.2 Main Street EB Thru-Right A 9.8 B 18.1 WB Thru B 12.1 B 14.4 Overall Intersection B 12.4 C 21.3 Pedestrian Peak Hour 200 (485) 710 (680) University Heights NB Left-Thru Right-turn D C 41.5 32.2 D 54.1 F 83.5 UMV Access SB Left-Thru-Right C 22.9 C 22.2 Main Street EB Thru-Right A 9.3 B 17.2 WB Thru B 10.3 B 14.7 Overall Intersection B 11.6 C 22.3
61.5 260 380 (800) 150 (745) 980 985 (440) 755 (240)
Scenario Peak Street Approach Lane Group Weekday AM Peak Hour Weekday PM Peak Hour LOS Delay
(sec/veh)
LOS Delay
(sec/veh)
Pedestrian Distribution for Balanced Delay for NB Movements Vehicle Peak Hour 385 (35) 195 (780) University Heights NB Left-Thru Right-turn C C 33.8 33.9 E E 61.5 UMV Access SB Left-Thru-Right C 23.2 C 22.2 Main Street EB Thru-Right A 9.2 B 17.5 WB Thru B 11.5 B 14.0 Overall Intersection B 11.7 C 20.9 Pedestrian Peak Hour 500 (305) 410 (860) University Heights NB Left-Thru Right-turn D D 35.6 35.8 E E 69.3 69.5 UMV Access SB Left-Thru-Right C 22.9 C 22.2 Main Street EB Thru-Right A 9.2 B 17.0 WB Thru B 10.3 B 14.5 Overall Intersection B 11.4 C 22.0 Redistributed Pedestrian Volumes with West-Side Sidewalk (PM Only) Pedestrian Peak Hour 845 125 University Heights NB Left-Thru Right-turn D 40.6 F 138.8 UMV Access SB Left-Thru-Right C 22.2 Main Street EB Thru-Right B 16.9 WB Thru B 14.7 Overall Intersection C 25.4
NOT TO SCALE