Agenda Background The selected solution ICTCT 2017 Olomouc Data - - PDF document

agenda
SMART_READER_LITE
LIVE PREVIEW

Agenda Background The selected solution ICTCT 2017 Olomouc Data - - PDF document

Agenda Background The selected solution ICTCT 2017 Olomouc Data Results Red light walking, transportation time Summary and attitudes in crossing with intelligent green light for pedestrians Niels Agerholm Head of Division


slide-1
SLIDE 1

ICTCT 2017 Olomouc

Red light walking, transportation time and attitudes in crossing with intelligent green light for pedestrians

Niels Agerholm

Head of Division

Aalborg University

Agenda

  • Background
  • The selected solution
  • Data
  • Results
  • Summary

Background

  • More vulnerable road users (VRU) (here

pedestrians) are desired

  • Most accidents with VRU in intersections
  • The targets are:

– To make it safer and easier for VRU – To increase the capacity of urban intersections

The selected solution I

  • Smart green light for pedestrian

(based on real time pedestrian registrations)

– Radar-based – Green light (somehow) independent from each road side

  • No max. circulation time
  • Improved detection
  • Improved signal programs and more

coordination between intersections

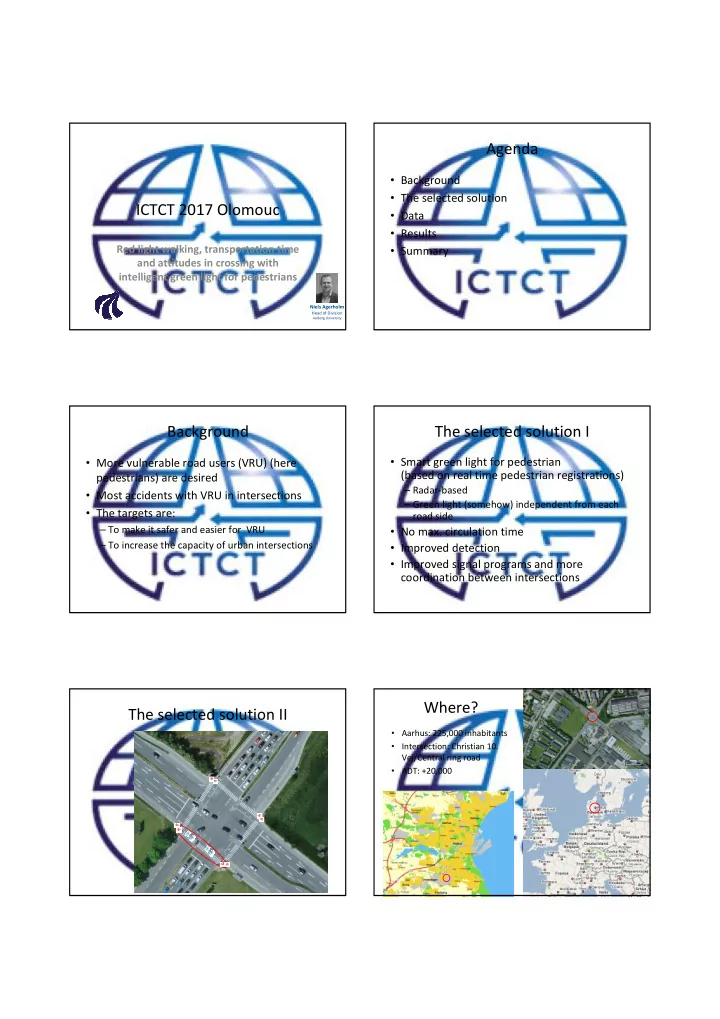
The selected solution II Where?

  • Aarhus: 225,000 inhabitants
  • Intersection: Christian 10.

Vej/Central ring road

  • ADT: +20,000
slide-2
SLIDE 2

Data I

  • Questionnaire data:
  • Short road side questionnaires (filled in on iPads)
  • 72 persons before and 53 after
  • Attributes:

– Gender, – Age, – User frequency, – waiting time, – red light walking, – waiting frequency on refugee island, – security, – estimated waiting time

Data II

  • Video recording:

– 2 two-weeks periods – 5:00-21:00 – 266+318 hours of recording

  • Time of passage – one day

– 173 before – 164 after

  • Red-light walking – the full data set

– 1,397 before – 1,474 after

  • RUBA used for data selection >> 99%

reduced time use

Results I – Experiences

  • Questionnaire data

Before After p-value

Often waiting for Green light (yes) 74% 66% 0,1022 Sufficient time to cross (yes) 32% 45% 0,1648 Passage after change to Red light (rare/never) 42% 68% 0,0014 Waiting on refugee island (rare/never) 67% 83% 0,1894 Security (yes/yes mostly) 75% 78% 0,2322 Own assessment of waiting time 0,7130

Test: Fisher’s exact test

Results II – Time of passage

  • Video recording

Interval [s] Peak period Off-peak period Befor e After Before After 0-30 15% 20% 25% 34% 31-60 28% 36% 46% 30% 61-90 27% 21% 21% 36% 91-120 26% 15% 0% 0% 121-150 4% 7% 8% 0% 151-180 0% 2% 0% 0% Mean time [s] 67.6 62.3 51.3 45.7 Test p-value Reduction in peak period 0,24325 Reduction in off-peak period 0,36786

Pedestrian area 2 Cross for red: 241 Finish with red: 915 Green light walking: 318 Pedestrian area 1 Cross for red: 233 Finish with red: 16 Green light walking: 1225 Pedestrian area 2 Cross for red: 608 Finish with red: 330 Green light walking: 459 Pedestrian area 1 Cross for red: 229 Finish with red: 13 Green light walking: 1155

Before After

Results III – Red-light walking

  • Video recording

– Red-light walking

  • Area 2 – Big effect: from 44 to

16%

  • Area 1: No effect: 16%

Test P-value Area 2 2,20E-16 Area 1 0,8441

Area 2 Area 1

slide-3
SLIDE 3

Summary

  • New, advanced pedestrian focused signal

system has been implemented in the City of Aarhus

  • Main results:

– Pedestrians experienced more easy passability – The measured time used for passage is reduced 5- 6 sec. (no statistically significants) – The share of red light walking pedestrians is reduced from 44 to 16%

Thank You☺

Niels Agerholm Division of Transportation Engineering

  • Dep. of Civil Engineering

Aalborg University +45 61 78 04 55 na@civil.aau.dk Rasmus Øhlenschlæger Division of Transportation Engineering

  • Dep. of Civil Engineering

Aalborg University ro@civil.aau.dk Charlotte Tønning Division of Transportation Engineering

  • Dep. of Civil Engineering

Aalborg University cht@civil.aau.dk