
SLIDE 1
Annual General Meeting Presentation Disclaimer 29 June 2017 - - PowerPoint PPT Presentation
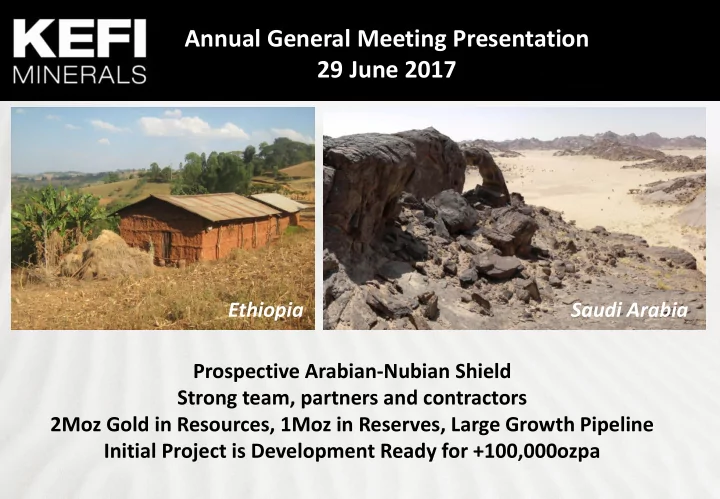
Annual General Meeting Presentation Disclaimer 29 June 2017 Ethiopia Saudi Arabia Prospective Arabian-Nubian Shield Strong team, partners and contractors 2Moz Gold in Resources, 1Moz in Reserves, Large Growth Pipeline Initial Project is
2
The information contained in this document (“Presentation”) has been prepared by KEFI Minerals plc (the “Company”). While the information contained herein has been prepared in good faith, neither the Company nor any of its shareholders, directors, officers, agents, employees or advisers give, have given or have authority to give, any representations or warranties (express or implied) as to, or in relation to, the accuracy, reliability or completeness of the information in this Presentation, or any revision thereof, or of any other written or oral information made or to be made available to any interested party or its advisers (all such information being referred to as “Information”) and liability therefore is expressly disclaimed. Accordingly, neither the Company nor any of its shareholders, directors, officers, agents, employees or advisers take any responsibility for, or will accept any liability whether direct or indirect, express or implied, contractual, tortious, statutory or otherwise, in respect of, the accuracy or completeness of the Information or for any of the opinions contained herein or for any errors,
This Presentation may contain forward-looking statements that involve substantial risks and uncertainties, and actual results and developments may differ materially from those expressed or implied by these statements. These forward-looking statements are statements regarding the Company's intentions, beliefs or current expectations concerning, among other things, the Company's results of operations, financial condition, prospects, growth, strategies and the industry in which the Company operates. By their nature, forward-looking statements involve risks and uncertainties because they relate to events and depend on circumstances that may or may not occur in the future. These forward-looking statements speak only as of the date of this Presentation and the Company does not undertake any obligation to publicly release any revisions to these forward-looking statements to reflect events or circumstances after the date of this Presentation. This Presentation should not be considered as the giving of investment advice by the Company or any of its shareholders, directors, officers, agents, employees or
taking such advice as may be deemed necessary. Neither this Presentation nor any copy of it may be (a) taken or transmitted into Canada, Japan, the Republic of Ireland, the Republic of South Africa or the United States of America (each a “Restricted Territory”), their territories or possessions; (b) distributed to any U.S. person (as defined in Regulation S under the United States Securities Act of 1933 (as amended)) or (c) distributed to any individual outside a Restricted Territory who is a resident thereof in any such case for the purpose of offer for sale or solicitation or invitation to buy or subscribe any securities or in the context where its distribution may be construed as such offer, solicitation or invitation, in any such case except in compliance with any applicable exemption. The distribution of this document in or to persons subject to other jurisdictions may be restricted by law and persons into whose possession this document comes should inform themselves about, and observe, any such restrictions. Any failure to comply with these restrictions may constitute a violation of the laws of the relevant jurisdiction. Note: All references to $ within this presentation refer to US$
debt-service & tax
Capital Structure1
AIM code KEFI Share price - 12 mth 3.93p (low) 11.38p (high) Share price (27/06/2017) 5.3p Shares in issue 333M Market cap £18M (c. $23M)
Key Shareholders
Lanstead 26% Odey Asset Mgmt 16% Lycopodium $2.5M Equity Ausdrill 5.0%
3
Focus and Targets
1) Data correct as of 27 June 2017
4
The shareholdings in KEFI Minerals plc do not take into account the potential effect of the exercise of incentive options
KEFI’s Status for Ethiopian Government:
5 5%
Odey
Ausdrill & Lyco
Board Public KEFI Minerals plc Saudi JV
Jibal Qutman, Hawiah, other
Ethiopia JV
Tulu Kapi Gold Project
Al Rashid Ethiopia Gov’t Off-site Infrastructure
40% 60%
Lanstead
26% 16% 3% 50%
Project Financier
work-in-progress
10 20 30 40 50 60 70 80 90 100 Guinea (Conakry) Kenya Zimbabwe Niger Mozambique Mali Angola Tanzania Zambia South Africa Democratic Republic of Congo (DRC) Madagascar Ethiopia Ivory Coast Eritrea Botswana Namibia Ghana Burkina Faso Morocco
6
Ethiopia ranked 51 of 109 countries in 2016 Fraser Institute Survey
7
1) IMF World Economic Outlook April 2016
15 years of 7-10% GDP growth, with a pro-development culture, Africa’s fastest growing economy (2015 - 10.2% Real GDP growth)1 Second most populous country in sub-Saharan Africa, ~100M people
Government is committed to achieving economic development through the Growth and Transformation Plan (GTP) Oct 16 State of Emergency, many restrictions lifted within weeks. Introduced independent land tribunal and other governance measures. Ranks ahead of Kenya, Mali, Mozambique and South Africa for Mining Investment Attractiveness per 2016 Fraser Institute Study HQ for African Union, provides UN peacekeepers for region
Ethiopia is
business
8
Source: Cantor Fitzgerald Europe research, June 2017. NPVs estimated at gold price of $1,300/oz. Examination of these statistics for companies that progress through start-up indicates that higher multiples can then apply. For instance, the Cantor Fitzgerald sub-group of 6 new gold producers indicates an average of EV/Reserve and EV/M&I Resource increasing to $314/oz and $262/oz, respectively.
Gold Company Subgroup Averages EV/NPV (x) EV/Reserve ($/oz) EV/M&I Resource ($/oz) EV/All Resource ($/oz) EV/Prod (S$/oz) In Construction 1.19 155 100 61 159 FS completed 0.72 113 80 51 125 PFS completed 0.62 58 56 42 67 PEA completed 0.49 89 74 66 102 KEFI 0.32 29 22 21 31 KEFI Premium/(discount) EV/NPV EV/Reserve EV/M&I Resource EV/All Resource EV/Prod Average In Construction
FS completed
PFS completed
PEA completed
9
Milestones achieved in H1-2017 for Tulu Kapi Gold Project in Ethiopia
Milestones achieved in H1-2017 for Jibal Qutman Gold Project in Saudi Arabia
Q3-17
Q4-17
10
production and cash flows
The operation is a strong initial production base Resources and Reserves
25 111 93 128 134 105 120 124 105 36 500 1,000 1,500
2 4 7 6 10 5 3 1 9 8 Production AISC
Open pit production and AISC
Koz Years
$/oz
Open Pit Project Economics
11
2017 KEFI Plan Unleveraged 2017 DFS Update Unleveraged 2015 DFS Unleveraged Funding by KEFI-Govt JV $160M $160M $130-150M Avg 8-yr NCF A/T to KEFI-Govt JV $52M p.a. $45M p.a. $40M p.a. Avg 8-year EBITDA $61M p.a. $55M p.a. $46M p.a. IRR 29% 23% 27% NPV at start of construction $122M $99M $125M NPV at start of production $263M $269M $266M
Tonnes (Mt) Grade (g/t Au)
(Koz) Probable Ore Reserves 15.4 2.12 1,050 Indicated Resources
17.7 1.1 18.8 2.49 5.63 2.67 1,420 200 1,620 Inferred Resources 1.4 2.40 100
NPVs @ 8% real discount rate on after tax cash flows at gold price = $1,250/oz
12
1) Production profile is indicative and based on preliminary studies only 2) Resource blocks below open pit: >1.5g/t Au (yellow) >5g/t Au (pink)
Resource, which is open at depth
5.2g/t Au containing 220Koz
and down plunge
and +800m further north
105 124 120 105 134 128 93 111 30 22 57 39 16 105 120 2 124 1 3 135 4 8 150 150 7 6 150 5 150
Open cut Underground
Potential production profile (Koz Au p.a.)1 Current underground resource2 The underground provides strong upside
Open pit
Current resource below open pit
13
Guji: Visible gold in drill Core Komto: Primary gold mineralisation
0 1km 2km
Source: KEFI Minerals
Sufficient Resources to start Mining Licence process for small operation to self-fund exploration
2013
shallow oxide gold
with larger open pit targets
Potential for large Cu-Au-Zn VHMS
Au) in surface trench results
indicate large buried metal-bearing structures
trending Wadi Bidah Mineral Belt which hosts over 30 undeveloped VHMS deposits
VHMS gossans in this belt
Sayid in KSA (Barrick) and Bisha in Eritrea (Nevsun) Over 1,000km2 under application
metal licenses over past 4 years, most of which have been turned
Jibal Qutman Pipeline of Targets Hawiah
14
15
Ethiopia
Saudi Arabia
resources for +30Koz pa Au from shallow open pits
Current Tulu Kapi and Jibal Qutman resources indicate:
KEFI’s large database and team’s experience provides:
Location of KEFI’s exploration portfolio in the ANS
Harry Anagnostaras-Adams, Executive Chairman John Leach, Finance Director Cyprus - Group corporate team Ethiopia - Development and exploration teams Saudi Arabia - Exploration team Email: info@kefi-minerals.com Website: www.kefi-minerals.com Luther Pendragon Ltd (Financial PR) Harry Chathli, Claire Norbury, Ana Ribeiro Tel: +44 (0) 20 7618 9100
16
@kefiminerals KEFI Minerals plc
Local community briefing at Tulu Kapi
Norman Ling, Non-Executive, Chair Nominations Review Committee – BA German and Economic History [Hons]
Norman was a member of the British diplomatic service for more than 30 years, for the last ten with the rank of ambassador. He has served in a wide range of countries in the Middle East and Africa. His last post, before retirement, was as Ambassador to Ethiopia, Djibouti and the African Union. For the last two years he has been actively involved with development of the mining industry in Ethiopia.
John Leach – Finance Director – BA Economices, MBA, MICA (Aust & Canada)
John has over 25 years’ experience in senior executive positions in the mining industry internationally and is currently also a non-executive director of Australian-listed Pancontinental Oil and Gas NL. He is a Member of the Institute of Chartered Accountants (Australia), a Member of the Canadian Institute
Harry Anagnostaras-Adams – Executive Chairman – MBA (Australian Graduate School of Business)
Harry was founder or co-founder of Citicorp Capital Investors Australia, investment company Pilatus Capital, Australian Gold Council, EMED Mining, KEFI Minerals and Cyprus-based Semarang Enterprises. He has overseen a number of start-ups in those and their related organisations principally through the roles of Chairman, Deputy Chairman or Managing Director. He qualified as a Chartered Accountant while working with PricewaterhouseCoopers.
18 Mark Wellesley-Wood, Non-Executive, Chair Technical Review Committee – BEng (Mining)
Mark is a mining engineer, with over 40 years’ experience in both the mining industry and investment banking. He has been closely involved in mining activities in Africa, having started his career on the Zambian copper-belt. Mark is a former Executive Chairman and CEO of South African gold miner, DRDGold Limited, and a former director of Investec Investment Banking and Securities in London. He is currently Chairman of AIM quoted Tri-Star Resources plc.
Ian Plimer – Non-Executive, Chair Exploration Review Committee – BSc Mining (UNSW) [Hons], PhD, FTSE, FGS, FAIMM
Ian is Emeritus Professor at The University of Melbourne where he was Professor and Head of the School of Earth Sciences (1991-2005). He was Professor
City Minerals Ltd and Niuminco Group Ltd and unlisted-companies Hancock Prospecting, TNT Mines Ltd and Perth Resources Ltd. He represents Hancock Prospecting on the Lakes Oil N.L. Board.
Sergio di Giovanni – Project Manager – BSc Metallurgy (Murdoch), MAusIMM
Over 23 years’ experience in operations in Australia, Asia, Europe, Mid-East and Americas. He has expertise in CIL, heap leach and flotation plants for gold, base metals and iron ore mines.
Guy Ware - Project Manager, Plant Contracting Co-ordinator – BEng Civil and Construction (WASM)
Guy has undertaken planning and delivery of process facilities throughout the resources industry, focussing on gold and base metals projects in Australia and Africa. With experience with world minerals processing leader Lycopodium, Guy has also been a project manager for GJ Engineering and Increva.
Kebede Belete – Country Manager Ethiopia – BSc (Geology), PhD, Mphil
Golden Prospect Mining Company, Minerva Resources and Nyota Minerals in roles including being Exploration Manager and Country Manager. Kebede has been involved with the Tulu Kapi gold project for more than 10 years.
19 Simon Cleghorn – Resource Manager – BEng Mining Geology [Hons] (WASM), MAusIMM
Simon is a geologist with 24 years’ experience in mining geology and project development with emphasis on resource and reserve estimation in primarily gold and base metals mines. His experience has been with international projects in Armenia, Georgia, Russia, South East Asia and project review in Europe and South America as well as Australia. He has been responsible for production geology management, due diligence project review and management of mining studies and project upgrades as well as resource and reserve.
Geoff Davidson – Mining Engineer, Mine Contracting Co-ordinator – BEng Mining (WASM), FAusIMM
Geoff has over 25 years’ experience in surface and underground mining with many years as Principal Consultant for a variety of major mining
Wayne Nicoletto, Managing Director, KEFI Ethiopia & KEFI Chief Operating Officer – BSc Metallurgy, Grad Dip Mining (WASM)
Wayne has 30 years' experience in the mining industry as a Metallurgist and a General Manager, specialising in start-up and operation of gold mines in Africa, Central Asia and Australia. Over the past 15 years, he has been primarily heading up operations in gold mines in Africa, including General Manager and Country Head of the Edikan Mine in Ghana and SMD in Guinea as well as Vice President of Operations of Boroo Gold Mine in Mongolia.
20
refinements since 2015 DFS
contract for Lycopodium to construct processing plant
The economic metrics tabulated above are for contract mining of the open pit
2017 DFS Update 2015 DFS Average head grade 2.1g/t gold 2.1g/t gold Total gold production 980,000 oz 961,000 oz Ore processing rate 1.5-1.7Mtpa 1.2Mtpa Gold recoveries 93.3% 91.5% Average annual gold production (first 8 years) 115,000 oz 95,000 oz Cash Operating Costs $684/oz $661/oz All-in Sustaining Costs $777/oz $780/oz All-in Costs (including initial capex) $933/oz $906/oz Net Operating Cash Flow (average for first 8 years) $55M pa $50M pa
21
parameter to achieve planned ore grade from Tulu Kapi open pit
been an important focus since KEFI became
model
rock (green)
reducing edge dilution
the main aims of the selected mining approach, grade control and blasting design
Photo of drill core through typical ore lode with assay results in g/t gold
22
hangingwall to footwall
productive top loading process (utilising 200t excavator)
productive bottom loading process (utilising 120t excavator)
mining to better anticipate grade variability
Planned mining cycle
23
Discovery, DFS and Financing Development/ construction Operation and production Closure Value
100% 75% 50% 25% 0%
Time
Value build
M&A
Select target areas of exploration 1 Identify areas of likely mineralisation (sampling) 2 Drilling, channel sampling to establish mineralisation 3 Pre-feasibility study 6 Reserve definition 7 Closure 15 Environmental rehabilitation 16
Prospecting and exploration
Fund “sweet spot”
Commissioning 11 Begin commercial production 12 Reach steady state 13 Feasibility study 8 Raise funding 9 Project construction 10 Declining production 14 Secure permits, leases and licenses 4 Resource definition 5
24
2-3ppm Au
VHMS Cu-Au deposit KEFI has Hawiah 7 ELAs in the Wadi Bidah Belt which cover cumulative +8km of Cu-Au gossans BRGM drilling in 1980’s on similar gossans in the area total 1.2Mt at 6.4g/t Au for 254Koz Au Strong 2km long, 300m from surface SP anomaly (in blue >125mV)
each of the 18 monthly settlements that commence in May 2017
an agreed period prior to the monthly settlement date to the Benchmark Price of 7.48 pence per share
a regular basis to help support KEFI’s activities over the coming 18 months
26