Data Understanding Surface Water Runoff at SED The data presented in - - PDF document

data
SMART_READER_LITE
LIVE PREVIEW

Data Understanding Surface Water Runoff at SED The data presented in - - PDF document

8/14/2009 Understanding The Water Budget at Soaring Eagle Dairy 4 Data Understanding Surface Water Runoff at SED The data presented in this presentation were Eric Cooley and Dennis Frame provided by the U.S. Geological Survey as part UW


slide-1
SLIDE 1

8/14/2009 1 Understanding Surface Water Runoff at SED

Eric Cooley and Dennis Frame UW Extension/Discovery Farms

Understanding The Water Budget at Soaring Eagle Dairy ‐ 4

Data

  • The data presented in this presentation were

provided by the U.S. Geological Survey as part

  • f a cooperative agreement with the UW‐

Discovery Farms Program.

Water budget

  • Monitored from Dec. 2004 ‐ Oct. 2006
  • Field year = 12‐months (Nov 1 – Oct 31)

Field year = 12 months (Nov. 1 Oct. 31)

– Always represents the year in which it ends

  • Field year coincides with the crop year.

2005 Field Year

  • The first year November 2004 – October 2005 =

drought year.

  • Precipitation (ice, sleet and snow) was 21.7

inches, compared to the 30‐year average of 30.5 inches for Manitowoc County.
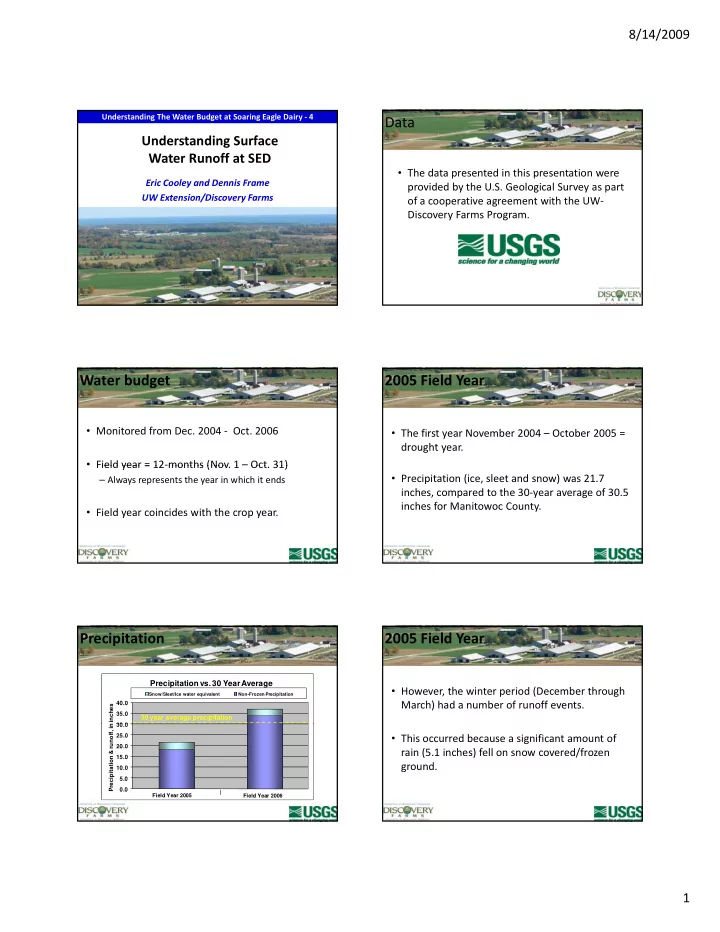
Precipitation

30 0 35.0 40.0 inches

Precipitation vs. 30 Year Average

Snow/Sleet/Ice water equivalent Non-Frozen Precipitation

30 year average precipitation

0.0 5.0 10.0 15.0 20.0 25.0 30.0 Precipitation & runoff, in Field Year 2005 Field Year 2006

2005 Field Year

  • However, the winter period (December through

March) had a number of runoff events.

  • This occurred because a significant amount of

rain (5.1 inches) fell on snow covered/frozen ground.

slide-2
SLIDE 2

8/14/2009 2

2005 Field Year

  • Surface water began flowing December 2004 after

rain events including 0.63” on 12/7 and 1.19” on 12/9‐10 .

  • Water flowed through December into January even
  • Water flowed through December into January, even

after air temperatures dropped below freezing and precipitation had ended.

  • The prolonged surface runoff during below‐freezing

air temperatures was surprising.

2005 Field Year

  • Typically in watersheds, runoff exhibits a rapid

response to rain or melting snow, and then over a relatively short period of time (minutes to hours) the flow greatly diminishes and stops hours) the flow greatly diminishes and stops.

  • Discovered that the majority of runoff appeared

to be coming from subsurface tiles that emptied into the waterway above the monitoring site.

2005 Field Year

  • Concerns about the influence of tile on runoff

include:

– Much of the area drained by this tile was not under SED l l d d i k control ‐ land and management practices were unknown – Drainage area for this tile was unknown – Some of the tile systems contained surface inlets, which greatly increase the potential for nutrients and sediment to run off into the site.

Surface Water Inlets

Extended flow and freezing temperatures caused the runoff to freeze downstream

  • f the site.

Pools formed causing an ice dam. Once established, water filled the flume with ice. Discharge measurements could not be considered accurate, so samples were not taken. Flume remained encased in ice until early March. After the ice was removed, debris remained downstream causing water to backup during surface water events. Temporary fixes and lower surface water runoff volumes allowed accurate flow measurement and water sampling to resume in early April 2005.

slide-3
SLIDE 3

8/14/2009 3

2005 Field Year

  • No data were reported between mid‐December

2004 and mid‐March 2005.

  • Runoff volumes and the associated nutrient and

sediment losses reported for the 2005 field year are greatly underestimated and should not be used, or used with caution.

2005 Field Year

  • To improve the

site, the waterway was re‐graded to create better getaway conditions.

2006 Field Year

  • Second year was much different than the first.
  • 37 1” precipitation (ice sleet & snow)
  • 37.1 precipitation (ice, sleet, & snow)

– > 6” above the 30‐year average

  • Majority recorded in the spring (May 7.1”)

Precipitation

30 0 35.0 40.0 inches

Precipitation vs. 30 Year Average

Snow/Sleet/Ice water equivalent Non-Frozen Precipitation

30 year average precipitation

0.0 5.0 10.0 15.0 20.0 25.0 30.0 Precipitation & runoff, in Field Year 2005 Field Year 2006

2006 Field Year

  • May 12, 2006; ground

was saturated.

  • Rains created more

Rains created more challenges:

– Runoff observed cutting under the wingwall after a 2.5‐ inch rain event.

2006 Field Year

  • Cutting produced a

hole under the wall

  • The hole was filled

The hole was filled May 24 with a combination of sand bags and bentonite, stopping the tunneling.

slide-4
SLIDE 4

8/14/2009 4

2006 Field Year

  • From May 27 – May 31

the site received nearly 3” of rain, causing significant causing significant runoff, and the flume

  • vertopped.
  • Caused significant

tunneling

2006 Field Year

  • Runoff volumes for the tunneling periods

were estimated by:

– estimating hole size, flow rate and head pressure; – extrapolating the hydrograph from a point where the hole formed; and – comparison to hydrographs from other local Discovery Farms sites.

2006 Field Year

  • Although these periods of discharge were

estimated and were not as accurate as a typical monitoring station, the runoff amounts and the associated sediment and nutrient losses should be reasonable for the 2006 field year.

2006 Field Year

  • From January 2006 – July 2006, the site flowed a total
  • f 190 days.

– did not flow 22 days

  • Not typical for surface water driven sites

– Provides proof of significant impact of tile discharge.

  • Upstream tile contributed significant portion of the

flow

2006 Field Year

  • 2006 had significantly more precipitation than

2005

37 1 inches versus 21 7 inches – 37.1 inches versus 21.7 inches

  • 18% (6.6”) ran off the field

2006 Field Year

  • Majority occurred in the spring when soils were saturated
slide-5
SLIDE 5

8/14/2009 5

2006 Field Year

  • 73% came under non‐frozen conditions

Conclusions

  • Tiles draining into the waterway contributed a

significant amount of runoff water to the basin. l i b d h l h d

  • Conclusion based on the larger than expected

flow volumes and the long duration of the flow through the monitoring station.

– In Eastern Wisconsin tile drainage systems are common.

Conclusions

  • Tile drainage greatly influenced surface flow.
  • Caused waterway to behave more like an

i i intermittent stream

– To accurately monitor a stream, a more permanent structure (concrete or sheet piling) needs to be constructed and flume‐sizing may need to be increased in these landscapes due to the larger flow of water.

Conclusions

  • When monitoring surface water on cropland with

tile drainage systems, it is important to accurately identify the tile drainage area.

  • Tiles can drain water from fields outside the

watershed (as identified by slopes) and empty into streams or waterways. This is often the case for fields that are internally drained (closed depressions).

Information Available

  • This presentation is the fourth in a series of six

developed to provide the data and information collected at Soaring Eagle Dairy. g g y

  • All of the presentations, factsheets and briefs

are available on the UW ‐ Discovery Farms website.

Information Available

  • There are six factsheets available on SED.
  • There are six briefs available on SED (2 page

i f h f h ) summaries of the factsheets).

  • There are six presentation available on SED.
slide-6
SLIDE 6

8/14/2009 6 For Additional Information http://www.uwdiscoveryfarms.org

UW Discovery Farms 40195 Winsand Drive 40195 Winsand Drive PO Box 429 Pigeon Falls, WI 54760 1‐715‐983‐5668

jgoplin@wisc.edu or drframe@wisc.edu